
How it works
The idea
Stocks that have risen the most over the past year tend, on average, to keep outperforming for a while. This “momentum” effect is one of the most studied patterns in finance. Every strategy here is built on it.
The 12-1 momentum rule
Every strategy here ranks stocks with 12-1 momentum, the classic academic and institutional way to measure a stock’s trend. It goes back to a well-known 1993 study by the economists Narasimhan Jegadeesh and Sheridan Titman, “Returns to Buying Winners and Selling Losers” (Journal of Finance). They found that US stocks that had done best over the previous three to twelve months went on, on average, to beat those that had done worst over the following months. Researchers have since found the same pattern in many decades and many countries’ markets, and it is one of the most studied patterns in finance.
The “12-1” is the measuring window: a stock’s return over the past twelve months, leaving out the latest one month. The last month is left out because over very short spans prices tend to partly reverse, so including it adds noise rather than trend. In practice the site takes the price about a month ago (21 trading days) and divides it by the price about a year ago (252 trading days). A stock that went from $50 to $80 over those eleven months has 12-1 momentum of +60%, whatever it did in the last few weeks.
The pattern holds on average, not every time. Momentum has had sharp, sudden losses, most famously in 2009, when the stocks that had fallen hardest rebounded fastest. That is why each strategy’s page shows its worst falls alongside its returns.
What every strategy does
- The pool: the 500 most traded US stocks and ADRs (by 20-day dollar volume), priced at $5 or more, trading at least $10 million a day, and not on over-the-counter markets.
- Quality: only companies with positive free cash flow in their latest quarterly report.
- The signal: 12-1 momentum (above): each stock’s return over the last twelve months, leaving out the most recent month.
- Spread: at most two stocks from any one sector.
- Costs: 0.10% is charged on every purchase and sale.
The strategies differ in how many stocks they hold, how often they rebuild (monthly, every two weeks or weekly), whether they weight the strongest stocks more, and a few extra filters, all listed on each strategy’s page.
Key terms
- Momentum
- The tendency of stocks that have risen the most over the past year to keep doing better than others for a while.
- 12-1 momentum
- A stock’s price change over the past twelve months, leaving out the latest month. It is how every strategy here ranks stocks.
- Strategy (model portfolio)
- A fixed set of rules that decides which stocks to own and how much of each, run with pretend money. No real money is invested.
- Backtest
- The rules applied to past prices to show how they would have done. The results are hypothetical.
- Go-live date and live results
- The day a strategy started running in real time. Since then, each decision has been made at that day’s close with the rules unchanged, and nothing published is revised.
- SPY
- A fund that tracks the S&P 500, an index of about 500 large US companies. It is the usual yardstick for US stocks.
- Rebuild
- The scheduled day a strategy ranks the stocks again and trades: monthly, every two weeks or weekly.
- Weight
- The share of the portfolio held in one stock.
- Largest drop (worst fall)
- The biggest decline from a high point to a later low. A simple measure of risk.
- Sharpe ratio
- The return earned for each unit of day-to-day ups and downs. Higher means a smoother ride for the same gain.
- T-bills and BIL
- Treasury bills are short-term US government debt, close to cash. BIL is a fund that holds them; the Split option keeps part of the account in it.
- 200-day average
- A stock’s average closing price over the past 200 trading days. Trading above it is a common sign of a rising trend.
Backtest and forward test
The price history used here begins in September 2016, and each strategy needs a year of prices before its first pick, so results start on November 1, 2017. From then up to each strategy’s go-live date, the results are a backtest: the frozen rules applied to past prices. The rules were chosen after studying that same history, which makes a backtest look better than the future is likely to be.
After go-live, the results are a live forward test. Each trading evening, after the market closes, the day’s prices are collected, every strategy decides from data available that day, and this site is rebuilt. Nothing already published is ever revised, and the rules cannot change: a changed rule would be a new strategy with its own record.
Amounts are only a scale
The record is kept as returns, so it looks the same whether you think of $1,000 or $1,000,000. The pages show any amount you choose, from any start date, and the holdings table shows what each weight would be of that amount. A model that holds 10–15 stocks, some at a few percent, assumes fractional shares; with a small amount, whole-share rounding and minimum trade sizes would make real results differ.
Timing
A decision is made on one day’s closing prices and traded at the next day’s close. Monthly strategies decide on the last trading day of each month; weekly ones on the last trading day of each week; the every-two-weeks one on the last trading day of every other week.
What to keep in mind
- Momentum strategies can fall hard: every strategy here has lost 35–50% from a high at some point.
- The weighted strategies can hold a few stocks in very large amounts.
- Much of the past decade’s gain came from technology stocks; a different decade could look very different.
- Results ignore taxes and assume trades at the closing price.
This site is for information and education. It is not investment advice, and nothing here is an offer to buy or sell any security.
The Bull Rhythm Weekly · every Friday after the close
Follow the strategies as they run live
Eight strategies with fixed rules, every decision made at the day’s close. Each Friday, see where the record stands: what each one made, what it bought and sold, and why.
- This week’s result and the running total since going live, next to the S&P 500
- Every buy and every sale, with the reason in plain words
- What each one holds now, with charts
- The good weeks and the bad ones, reported the same way
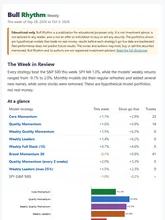 See a sample
issue →
See a sample
issue →