
Free · Educational · Every trade published
Eight momentum strategies. Every holding. Every trade. Every day.
Bull Rhythm follows eight systematic 12-1 momentum portfolios with fixed, published rules. See how stock selection, position size, diversification and how often a portfolio is rebuilt shape its returns and its risk, with every holding and every trade published after each close, free and for education.
- 8 strategies
- Published rules
- Tracked every trading day
- Every holding and trade
The portfolios use pretend money. They have run live since Sep 28, 2026 (prices to the close of Nov 6, 2026); results before that date are a backtest, the same rules applied to past prices. New to this? Key terms explained.
Since going live on Sep 28, 2026
How much each strategy has gained or lost since it started running live, to the close of Nov 6, 2026, compared with SPY, a fund that tracks the S&P 500. Each evening the rules choose from that day’s closing prices, and nothing is changed afterwards.
- SPY (S&P 500) -4.0%
- Broad Momentum 30 -9.7%
- Core Momentum -13.0%
- Weekly Full Stack (15) -29.1%
- Weekly Leaders (max 25%) -29.4%
- Weekly Quality Momentum -32.2%
- Quality Momentum (every 2 weeks) -33.0%
- Weekly Leaders -34.6%
- Quality Momentum -36.4%
The foundation of Bull Rhythm
Built on decades of momentum research
Momentum investing has a long academic history. In 1993, Narasimhan Jegadeesh and Sheridan Titman documented that stocks with strong returns over the previous three to twelve months tended, on average, to outperform stocks with weak returns over the following months. Bull Rhythm follows eight transparent, rules-based portfolios built on the established 12-1 momentum measure.
- 1993The foundational researchJegadeesh and Titman published “Returns to Buying Winners and Selling Losers: Implications for Stock Market Efficiency”, an influential study of intermediate-term stock momentum.
- 12-1An established conventionMeasure a stock’s return over about one year, leaving out the latest month. Skipping the month follows the wider momentum research and the work on short-term reversals.
- 8Bull Rhythm todayEight fixed-rule 12-1 momentum portfolios, with their current holdings, every trade and their performance, tracked every trading day in one place.
Academic source. Jegadeesh, N. & Titman, S. (1993). Returns to Buying Winners and Selling Losers: Implications for Stock Market Efficiency. The Journal of Finance, 48(1), 65–91. Read the original paper (opens the publisher’s page) ↗
The 1993 findings helped establish the momentum research; the exact 12-1 measure used here is a later convention of that research, not a detail of the paper alone. Past patterns do not ensure future returns, and momentum portfolios can suffer sharp reversals.
The eight strategies, live
Tracked live since Sep 28, 2026 (3 added the next day), to the close of Nov 6, 2026: each decision made from that day’s closing prices with the rules unchanged. The live record is young; the worst fall comes from the backtest (the same rules applied to prices from November 2017 to go-live), not from live trading. Bold: ahead of SPY.
| Strategy | Rebuilds | Since go-live | SPY, same days | Largest holding now | Worst fall in the backtest |
|---|---|---|---|---|---|
| Core Momentum | Monthly | -13.0% | -4.0% | ROKU 7.5% | -35.4% |
| Quality Momentum | Monthly | -36.4% | -4.0% | AXTI 30.3% | -50.8% |
| Weekly Quality Momentum | Weekly | -32.2% | -4.0% | AXTI 30.3% | -44.7% |
| Weekly Leaders | Weekly | -34.6% | -4.0% | AXTI 40.7% | -47.4% |
| Weekly Full Stack (15) | Weekly | -29.1% | -4.0% | AXTI 35.0% | -41.3% |
| Broad Momentum 30 | Monthly | -9.7% | -3.8% | NEM 3.9% | -32.5% |
| Quality Momentum (every 2 weeks) | Every 2 weeks | -33.0% | -3.8% | AXTI 30.3% | -47.1% |
| Weekly Leaders (max 25%) | Weekly | -29.4% | -3.8% | AXTI 23.2% | -44.6% |
One momentum approach. Eight ways to build a portfolio.
Every strategy ranks the 500 most traded US stocks by the same 12-1 momentum. They differ in how many stocks they hold, how often they rebuild, how much they put in the strongest and which extra screens a stock must pass. Each strategy’s page lists its exact rules.
- 15 stocks or 30Core Momentum holds 15 stocks and Broad Momentum 30 30 (up to 3 a sector instead of 2), both in equal amounts and rebuilt monthly: what spreading the money wider changes.Compare them →
- Monthly, every two weeks or weeklyQuality Momentum, Quality Momentum (every 2 weeks) and Weekly Quality Momentum follow the same rules and differ only in how often they rebuild: what that does to holdings, trading and results.Compare them →
- A cap on the largest holding, or noneWeekly Leaders puts much more money in the strongest stocks; Weekly Leaders (max 25%) is the same with no stock above 25% of the portfolio: what a size limit does to the exposure to the strongest names.Compare them →
- More screens before a stock is chosenThe Quality strategies add improving gross margins and skip stocks up more than 40% in a month; Weekly Full Stack (15) adds only the biggest margin improvers, no new buys in the week before a company’s expected results, and less money in stocks that move with the largest holding.Compare them →
What the portfolios are showing
Week of Oct 30, 2026 to Nov 6, 2026 (closing prices), from the live record and the latest holdings. Written by rule from the numbers each trading day; descriptions of what happened, not forecasts.
- ConcentrationThe largest holding in Weekly Leaders, AXTI, is 40.7% of the portfolio: its 10 stocks behave like 4.2 equal holdings, so a single stock can move the whole result.
- How often it rebuildsOver the week, the same Quality rules returned monthly -19.5%, every 2 weeks -21.1%, weekly -21.1%: 1.6 points apart. One week describes what happened; it is not a long-term conclusion.
- Participation0 of 8 strategies did better than SPY over the week (SPY -2.7%), and 0 gained. Each strategy’s page shows the holdings that moved it.
- Shared holdings16 stocks are held by two or more strategies; AXTI by 8 of 8. With an equal amount in each strategy, the shared stocks would be 92.7% of the money.
The eight strategies tracked
Each strategy is a model portfolio: a fixed set of rules that decides which stocks to own and how much of each. All eight start from the same idea, owning the stocks with the strongest one-year trends, and differ in how many stocks they hold, how often they trade and how much they put in the strongest. They are grouped below by style; open a group to see its strategies, then choose one for its full history, holdings and trades. “Largest drop” is the biggest fall from a high point, a simple measure of risk.
SteadyMonthly, equal amounts in each stock. The calmest of the three.
Core Momentum
The 15 strongest trends, in equal amounts, rebuilt once a month.
- Since go-live
- -13.0%
- Largest drop since 2017
- -35.4%
Broad Momentum 30
30 strong trends in equal amounts, rebuilt once a month: the most spread-out of all.
- Since go-live
- -9.7%
- Largest drop since 2017
- -32.5%
QualityStrong trends at companies whose profitability is improving, more money in the strongest.
Quality Momentum
10 strong trends at companies whose profitability is improving, weighted toward the strongest, monthly.
- Since go-live
- -36.4%
- Largest drop since 2017
- -50.8%
Quality Momentum (every 2 weeks)
Quality Momentum, rebuilt every other week: a middle speed between monthly and weekly.
- Since go-live
- -33.0%
- Largest drop since 2017
- -47.1%
Weekly Quality Momentum
Quality Momentum, rebuilt every week so it reacts faster.
- Since go-live
- -32.2%
- Largest drop since 2017
- -44.7%
LeadersWeekly, leaning hardest into the very strongest trends. The biggest gains and the biggest falls.
Weekly Leaders
Leans hardest into the very strongest trends, rebuilt weekly.
- Since go-live
- -34.6%
- Largest drop since 2017
- -47.4%
Weekly Leaders (max 25%)
Weekly Leaders with a limit: no stock takes more than a quarter of the money.
- Since go-live
- -29.4%
- Largest drop since 2017
- -44.6%
Weekly Full Stack (15)
15 strong trends at the companies improving fastest, with extra safety checks, rebuilt weekly.
- Since go-live
- -29.1%
- Largest drop since 2017
- -41.3%
What would your money have done?
See what an amount would have grown to in each strategy, from a start date you choose. The price history used here begins in September 2016, and each strategy needs a year of prices before its first pick, so results start on November 1, 2017.
$10,000 put in at the close of Nov 1, 2017, worth at the close of Nov 6, 2026:
Results before each strategy’s go-live date are a backtest: the rules applied to historical prices. Backtested performance is hypothetical and may not be achieved in live trading.
Growth of $10,000
The dashed grey line is SPY, a fund that tracks the S&P 500, the usual yardstick for US stocks.
Falls from the high, yearly returns and risk on the Performance page →
This week’s key observations
From the close of Oct 30, 2026 to the close of Nov 6, 2026.
- 01Strategy movementBest: Broad Momentum 30, -6.4%. Weakest: Weekly Leaders, -22.2%. SPY: -2.7%. 0 of 8 did better than SPY.
- 02New holdings and exits8 of 8 strategies rebuilt: 19 different stocks bought and 18 sold. Most bought: TWLO (5 strategies). Most sold: NUE (5).
- 03Concentration and overlapAXTI was the largest loss in 8 of 8 strategies (−0.9 points to −13.3 points): when strategies share their biggest holdings, their weeks move together.
This week’s moves
What each strategy bought and sold in live trading from Oct 31, 2026 to Nov 6, 2026. A strategy trades only on its schedule (monthly, every two weeks or weekly), so some weeks it makes no trades. Each strategy’s page lists every trade with its reason.
Core Momentum
Bought 4 TXG, MPC, GEV, FIX; Sold 4 SN, PBF, CRL, BE.
Biggest new holding: TXG at 6.7% of the portfolio: its price rose 588% over the past year, leaving out the last month.
Quality Momentum
Bought 4 TXG, TWLO, MPC, GEV; Sold 4 PBF, NUE, CRL, BE.
Biggest new holding: TXG at 18.0% of the portfolio: its price rose 588% over the past year, leaving out the last month.
Weekly Quality Momentum
Bought 1 TWLO; Sold 1 NUE.
Biggest new holding: TWLO at 5.2% of the portfolio: its price rose 170% over the past year, leaving out the last month.
Weekly Leaders
Bought 1 TWLO; Sold 1 NUE.
Biggest new holding: TWLO at 3.0% of the portfolio: its price rose 170% over the past year, leaving out the last month.
Weekly Full Stack (15)
Bought 4 WAB, ILMN, HLT, GEV; Sold 4 WSM, CNC, CAT, ALL.
Biggest new holding: WAB at 3.0% of the portfolio: its price rose 43% over the past year, leaving out the last month.
Broad Momentum 30
Bought 14 WCC, VZ, TXG, STT, SPG, ROST and 8 more; Sold 13 SN, PBF, MU, MRK, MNST, JBHT and 7 more.
Biggest new holding: WCC at 3.3% of the portfolio: its price rose 64% over the past year, leaving out the last month.
Quality Momentum (every 2 weeks)
Bought 3 TWLO, MPC, GEV; Sold 3 PBF, NUE, BE.
Biggest new holding: TWLO at 5.2% of the portfolio: its price rose 170% over the past year, leaving out the last month.
Weekly Leaders (max 25%)
Bought 1 TWLO; Sold 1 NUE.
Biggest new holding: TWLO at 4.4% of the portfolio: its price rose 170% over the past year, leaving out the last month.
Why 12-1 momentum?
The research above explains where momentum comes from; this is how the 12-1 measure works.
- 12Look back about a yearEach stock’s price change over the past twelve months, splits and dividends included.
- −1Skip the latest monthThe most recent month is left out of the ranking, because very short-term moves often reverse.
- 8Eight ways to build itEach strategy turns the same ranking into a portfolio by its own published rules.
The exact windows, screens, weights and trading rules are on each strategy’s page and in How it works. A historical pattern is not a promise of future returns.
Transparent by design
- Published, fixed rulesEvery strategy’s selection and rebuild rules are listed step by step on its page. Changing a rule would make a new strategy with its own record.
- Every holding and every tradeWhat each portfolio owns at each close, and every buy and sale with its reason, downloadable as a spreadsheet.
- Backtest and live record kept apartResults before go-live are a backtest; after it, decisions are made at each day’s close and never changed. Every chart marks the boundary.
- Costs, fills and risk0.10% on every trade, trades at the next day’s close, falls from the high and the data’s limits: Performance, Research and the disclaimer.
A model record with pretend money: not an audited track record and not real-money trading.
The Bull Rhythm Weekly · every Friday after the close
Follow the strategies as they run live
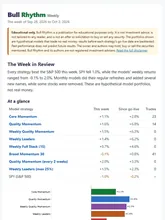
Eight strategies with fixed rules, every decision made at the day’s close. Each Friday, see where the record stands: what each one made, what it bought and sold, and why.
- This week’s result and the running total since going live, next to the S&P 500
- Every buy and every sale, with the reason in plain words
- What each one holds now, with charts
- The good weeks and the bad ones, reported the same way
 See a sample
issue →
The market this week
The S&P 500 is down 2.7% this week, and most stocks rose: 1,940 up and 1,932 down. New 52-week highs outnumber new lows, 502 to 314. 53% of stocks are above their 200-day average (their average price over the past 200 trading days, a common sign of a rising trend), down from 55% last week. Market health for momentum stocks, and all the market measures →
Shown for context: the strategies do not use these measures.

From the same author
Bear Rhythm: how healthy is the market under the surface?
The Hindenburg Omen, the McClellan Oscillator and more market breadth indicators, read across thousands of US stocks after every close, each with its exact rule and its record since 2017.
- A market health score and a market top risk score, every trading day
- Whether breadth is confirming the S&P 500’s new highs, or diverging from them
- The Bear Rhythm weekly report by email every Friday