
Market health
Two scores, read after every close: the health of the 500 stocks the Bull Rhythm strategies choose from, and of the whole US market. Each comes with its indicators, its record since 2017 and interactive charts.
Momentum stocks
the 500 stocks the strategies choose from
2 bullish · 1 neutral · 6 bearish of 9
Close of Oct 16, 2026 · down 44 on the week
Whole market
every US stock over $5
2 bullish · 4 neutral · 1 bearish of 7
Close of Oct 16, 2026 · up 7 on the week
Two lenses on the same day. Momentum stocks: how healthy the trends are among the stocks the strategies choose from (not the strategies’ own results; those are on the Performance page). Whole market: the same question for every US stock over $5. Both describe the stocks today; neither is a forecast or a trading signal, and the strategies do not use them.
Momentum stocks: the 500 stocks the strategies choose from
The momentum stocks read Weak (28 of 100): 2 of the 9 indicators bullish, 6 bearish. Over the past month the strongest tenth of the pool trailed the weakest by 3.9%. 30% of the 50 leaders are above their 50-day average. The score is down 44 points from a week ago.
The 9 indicators today
- Momentum participation63%Bullish since Dec 22, 2025A high share means rising trends are widespread among the stocks the strategies choose from.A week ago: 63%
- Momentum payoff-3.9%Bearish since Oct 16, 2026Positive: momentum is paying. A sharp negative reading is how momentum crashes begin, the strongest stocks falling hardest.A week ago: +7.5%
- Leaders in trend30%Bearish since Oct 16, 2026The leaders are what the strategies hold; a falling share means the strongest trends are breaking.A week ago: 74%
- Leaders' pullback-26.1%Bearish since Oct 15, 2026Near zero, the leaders are at their highs; a deep median fall means even the strongest have given back a lot.A week ago: -15.9%
- Pool trend53% · 41% above the 50-dayNeutral since Sep 14, 2026Whether most of the strategies' universe is in a long-term rising trend.A week ago: 55%
- Net new highs+3.0%Bullish since Oct 15, 2026More new highs than lows means the pool is still making progress; the reverse is a sign of broad weakness.A week ago: +4.0%
- Leadership-6.8%Bearish since Oct 16, 2026Positive: the strongest stocks keep outpacing the rest, which is what momentum strategies need.A week ago: +10.5%
- Rotation40%Bearish since Oct 16, 2026Low: the leadership is stable. High: leadership is churning, which tends to mean more trading and whipsaws for momentum strategies.A week ago: 32%
- Crowding60% (Technology)Bearish since Apr 27, 2026Low: momentum is spread across the market. High: the strongest trends sit in one sector, so one sector's reversal would hit them together.A week ago: 60%
The score over time
The blue line is the score each day: every indicator counts the same, so it is 0 when all of them are bearish and 100 when all are bullish. The green band is the Strong zone (65 or more), the red band the Weak zone (35 or less). The grey line is SPY on its own scale, to show what the market was doing at the time; the dotted purple lines are the days the Hindenburg Omen fired.
- The score (blue line)
- SPY, the S&P 500, on its own scale
- Strong zone: 65 or more
- Weak zone: 35 or less
- A Hindenburg Omen day
Show this chart’s numbers as a table
| Month end | Value |
|---|---|
| Oct 31, 2017 | 89 |
| Nov 30, 2017 | 61 |
| Dec 29, 2017 | 61 |
| Jan 31, 2018 | 94 |
| Feb 28, 2018 | 89 |
| Mar 29, 2018 | 61 |
| Apr 30, 2018 | 61 |
| May 31, 2018 | 83 |
| Jun 29, 2018 | 56 |
| Jul 31, 2018 | 61 |
| Aug 31, 2018 | 94 |
| Sep 28, 2018 | 94 |
| Oct 31, 2018 | 44 |
| Nov 30, 2018 | 44 |
| Dec 31, 2018 | 39 |
| Jan 31, 2019 | 56 |
| Feb 28, 2019 | 83 |
| Mar 29, 2019 | 78 |
| Apr 30, 2019 | 67 |
| May 31, 2019 | 61 |
| Jun 28, 2019 | 67 |
| Jul 31, 2019 | 72 |
| Aug 30, 2019 | 72 |
| Sep 30, 2019 | 50 |
| Oct 31, 2019 | 61 |
| Nov 29, 2019 | 83 |
| Dec 31, 2019 | 67 |
| Jan 31, 2020 | 78 |
| Feb 28, 2020 | 50 |
| Mar 31, 2020 | 50 |
| Apr 30, 2020 | 44 |
| May 29, 2020 | 78 |
| Jun 30, 2020 | 78 |
| Jul 31, 2020 | 89 |
| Aug 31, 2020 | 78 |
| Sep 30, 2020 | 89 |
| Oct 30, 2020 | 44 |
| Nov 30, 2020 | 72 |
| Dec 31, 2020 | 83 |
| Jan 29, 2021 | 78 |
| Feb 26, 2021 | 50 |
| Mar 31, 2021 | 39 |
| Apr 30, 2021 | 50 |
| May 28, 2021 | 56 |
| Jun 30, 2021 | 83 |
| Jul 30, 2021 | 67 |
| Aug 31, 2021 | 78 |
| Sep 30, 2021 | 56 |
| Oct 29, 2021 | 94 |
| Nov 30, 2021 | 61 |
| Dec 31, 2021 | 56 |
| Jan 31, 2022 | 44 |
| Feb 28, 2022 | 78 |
| Mar 31, 2022 | 78 |
| Apr 29, 2022 | 50 |
| May 31, 2022 | 67 |
| Jun 30, 2022 | 11 |
| Jul 29, 2022 | 28 |
| Aug 31, 2022 | 50 |
| Sep 30, 2022 | 33 |
| Oct 31, 2022 | 67 |
| Nov 30, 2022 | 56 |
| Dec 30, 2022 | 39 |
| Jan 31, 2023 | 50 |
| Feb 28, 2023 | 44 |
| Mar 31, 2023 | 61 |
| Apr 28, 2023 | 78 |
| May 31, 2023 | 61 |
| Jun 30, 2023 | 72 |
| Jul 31, 2023 | 72 |
| Aug 31, 2023 | 78 |
| Sep 29, 2023 | 44 |
| Oct 31, 2023 | 39 |
| Nov 30, 2023 | 78 |
| Dec 29, 2023 | 67 |
| Jan 31, 2024 | 72 |
| Feb 29, 2024 | 89 |
| Mar 28, 2024 | 78 |
| Apr 30, 2024 | 44 |
| May 31, 2024 | 89 |
| Jun 28, 2024 | 61 |
| Jul 31, 2024 | 56 |
| Aug 30, 2024 | 89 |
| Sep 30, 2024 | 94 |
| Oct 31, 2024 | 89 |
| Nov 29, 2024 | 94 |
| Dec 31, 2024 | 61 |
| Jan 31, 2025 | 78 |
| Feb 28, 2025 | 50 |
| Mar 31, 2025 | 39 |
| Apr 30, 2025 | 78 |
| May 30, 2025 | 83 |
| Jun 30, 2025 | 89 |
| Jul 31, 2025 | 89 |
| Aug 29, 2025 | 61 |
| Sep 30, 2025 | 89 |
| Oct 31, 2025 | 78 |
| Nov 28, 2025 | 50 |
| Dec 31, 2025 | 56 |
| Jan 30, 2026 | 83 |
| Feb 27, 2026 | 61 |
| Mar 31, 2026 | 44 |
| Apr 30, 2026 | 83 |
| May 29, 2026 | 83 |
| Jun 30, 2026 | 78 |
| Jul 31, 2026 | 39 |
| Aug 31, 2026 | 39 |
| Sep 30, 2026 | 67 |
| Oct 16, 2026 | 28 |
What followed each band
| When the score was | Days | Separate spells | SPY over the next 3 months (average) | SPY’s worst fall in those 3 months (average) | Core Momentum over the next 3 months (average) |
|---|---|---|---|---|---|
| Strong | 1,316 | 125 | +2.8% | -4.8% | +6.9% |
| Firm | 371 | 193 | +4.4% | -4.7% | +9.7% |
| Mixed | 184 | 125 | +6.0% | -4.3% | +10.9% |
| Soft | 266 | 116 | +7.2% | -4.8% | +14.4% |
| Weak | 124 | 42 | +2.5% | -6.4% | +7.5% |
| Every day (the baseline) | 2,261 | – | +3.8% | -4.8% | +8.6% |
How to read it. Each row takes every trading day the score was in that band since 2017 and asks what happened next: the average return over the following three months (63 trading days), and the average of the deepest drop along the way. The last row is every day, the baseline to compare with. “Separate spells” counts the distinct stretches the days come from: neighbouring days overlap, so a band with few spells rests on few real episodes.
What it shows. After Weak days (124 days in 42 separate spells), SPY’s worst fall over the next three months averaged -6.4%, against -4.8% from any day; its average return was +2.5%, against +3.8%. After Strong days (1,316 days), SPY returned +2.8% on average and its worst fall averaged -4.8%. A description of the past, not a forecast.
Each indicator over time
The same layout for each: the blue line is the indicator, the green band its bullish zone, the red band its bearish zone (between them it counts as neutral), the grey line SPY, the dotted purple lines the Hindenburg Omen days.
Momentum participation: 63% Bullish
The share of the pool whose 12-1 momentum is positive: up over the past year, leaving out the latest month. A high share means rising trends are widespread among the stocks the strategies choose from.
- The indicator (blue line)
- SPY, the S&P 500, on its own scale
- Bullish zone (at or above 60%)
- Bearish zone (at or below 40%)
- A Hindenburg Omen day
Show this chart’s numbers as a table
| Month end | Value |
|---|---|
| Oct 31, 2017 | 83% |
| Nov 30, 2017 | 75% |
| Dec 29, 2017 | 78% |
| Jan 31, 2018 | 82% |
| Feb 28, 2018 | 83% |
| Mar 29, 2018 | 74% |
| Apr 30, 2018 | 75% |
| May 31, 2018 | 72% |
| Jun 29, 2018 | 72% |
| Jul 31, 2018 | 73% |
| Aug 31, 2018 | 78% |
| Sep 28, 2018 | 77% |
| Oct 31, 2018 | 73% |
| Nov 30, 2018 | 56% |
| Dec 31, 2018 | 57% |
| Jan 31, 2019 | 34% |
| Feb 28, 2019 | 49% |
| Mar 29, 2019 | 67% |
| Apr 30, 2019 | 62% |
| May 31, 2019 | 67% |
| Jun 28, 2019 | 60% |
| Jul 31, 2019 | 67% |
| Aug 30, 2019 | 57% |
| Sep 30, 2019 | 57% |
| Oct 31, 2019 | 70% |
| Nov 29, 2019 | 75% |
| Dec 31, 2019 | 87% |
| Jan 31, 2020 | 81% |
| Feb 28, 2020 | 77% |
| Mar 31, 2020 | 68% |
| Apr 30, 2020 | 33% |
| May 29, 2020 | 59% |
| Jun 30, 2020 | 56% |
| Jul 31, 2020 | 56% |
| Aug 31, 2020 | 66% |
| Sep 30, 2020 | 71% |
| Oct 30, 2020 | 66% |
| Nov 30, 2020 | 60% |
| Dec 31, 2020 | 72% |
| Jan 29, 2021 | 74% |
| Feb 26, 2021 | 83% |
| Mar 31, 2021 | 96% |
| Apr 30, 2021 | 96% |
| May 28, 2021 | 94% |
| Jun 30, 2021 | 95% |
| Jul 30, 2021 | 93% |
| Aug 31, 2021 | 91% |
| Sep 30, 2021 | 91% |
| Oct 29, 2021 | 91% |
| Nov 30, 2021 | 83% |
| Dec 31, 2021 | 71% |
| Jan 31, 2022 | 79% |
| Feb 28, 2022 | 65% |
| Mar 31, 2022 | 65% |
| Apr 29, 2022 | 63% |
| May 31, 2022 | 47% |
| Jun 30, 2022 | 45% |
| Jul 29, 2022 | 33% |
| Aug 31, 2022 | 38% |
| Sep 30, 2022 | 40% |
| Oct 31, 2022 | 25% |
| Nov 30, 2022 | 37% |
| Dec 30, 2022 | 38% |
| Jan 31, 2023 | 44% |
| Feb 28, 2023 | 49% |
| Mar 31, 2023 | 36% |
| Apr 28, 2023 | 49% |
| May 31, 2023 | 51% |
| Jun 30, 2023 | 61% |
| Jul 31, 2023 | 62% |
| Aug 31, 2023 | 71% |
| Sep 29, 2023 | 76% |
| Oct 31, 2023 | 61% |
| Nov 30, 2023 | 51% |
| Dec 29, 2023 | 68% |
| Jan 31, 2024 | 69% |
| Feb 29, 2024 | 70% |
| Mar 28, 2024 | 79% |
| Apr 30, 2024 | 80% |
| May 31, 2024 | 78% |
| Jun 28, 2024 | 75% |
| Jul 31, 2024 | 67% |
| Aug 30, 2024 | 75% |
| Sep 30, 2024 | 82% |
| Oct 31, 2024 | 89% |
| Nov 29, 2024 | 83% |
| Dec 31, 2024 | 80% |
| Jan 31, 2025 | 72% |
| Feb 28, 2025 | 73% |
| Mar 31, 2025 | 66% |
| Apr 30, 2025 | 65% |
| May 30, 2025 | 63% |
| Jun 30, 2025 | 68% |
| Jul 31, 2025 | 73% |
| Aug 29, 2025 | 67% |
| Sep 30, 2025 | 69% |
| Oct 31, 2025 | 71% |
| Nov 28, 2025 | 60% |
| Dec 31, 2025 | 69% |
| Jan 30, 2026 | 67% |
| Feb 27, 2026 | 68% |
| Mar 31, 2026 | 76% |
| Apr 30, 2026 | 72% |
| May 29, 2026 | 71% |
| Jun 30, 2026 | 71% |
| Jul 31, 2026 | 70% |
| Aug 31, 2026 | 65% |
| Sep 30, 2026 | 66% |
| Oct 16, 2026 | 63% |
Momentum payoff: -3.9% Bearish
Over the past month, the strongest tenth of the pool (by 12-1 momentum a month ago) against the weakest tenth: the difference in their average returns. Positive: momentum is paying. A sharp negative reading is how momentum crashes begin, the strongest stocks falling hardest.
- The indicator (blue line)
- SPY, the S&P 500, on its own scale
- Bullish zone (at or above +2.0%)
- Bearish zone (at or below -2.0%)
- A Hindenburg Omen day
Show this chart’s numbers as a table
| Month end | Value |
|---|---|
| Oct 31, 2017 | +4.5% |
| Nov 30, 2017 | -3.4% |
| Dec 29, 2017 | -5.8% |
| Jan 31, 2018 | +8.3% |
| Feb 28, 2018 | +5.2% |
| Mar 29, 2018 | -4.9% |
| Apr 30, 2018 | -3.6% |
| May 31, 2018 | +6.5% |
| Jun 29, 2018 | -6.2% |
| Jul 31, 2018 | -2.6% |
| Aug 31, 2018 | +7.3% |
| Sep 28, 2018 | +3.6% |
| Oct 31, 2018 | -4.7% |
| Nov 30, 2018 | -3.2% |
| Dec 31, 2018 | -0.6% |
| Jan 31, 2019 | -2.5% |
| Feb 28, 2019 | +3.4% |
| Mar 29, 2019 | +0.7% |
| Apr 30, 2019 | -1.7% |
| May 31, 2019 | +15.4% |
| Jun 28, 2019 | -5.6% |
| Jul 31, 2019 | +4.1% |
| Aug 30, 2019 | +10.7% |
| Sep 30, 2019 | -14.6% |
| Oct 31, 2019 | -2.9% |
| Nov 29, 2019 | -1.9% |
| Dec 31, 2019 | -4.6% |
| Jan 31, 2020 | +9.4% |
| Feb 28, 2020 | +5.6% |
| Mar 31, 2020 | +11.7% |
| Apr 30, 2020 | -3.3% |
| May 29, 2020 | +13.2% |
| Jun 30, 2020 | +7.6% |
| Jul 31, 2020 | +14.3% |
| Aug 31, 2020 | -2.8% |
| Sep 30, 2020 | +11.3% |
| Oct 30, 2020 | -10.0% |
| Nov 30, 2020 | -13.7% |
| Dec 31, 2020 | +3.1% |
| Jan 29, 2021 | +21.7% |
| Feb 26, 2021 | -11.1% |
| Mar 31, 2021 | -11.5% |
| Apr 30, 2021 | -6.5% |
| May 28, 2021 | -4.7% |
| Jun 30, 2021 | +5.2% |
| Jul 30, 2021 | +0.1% |
| Aug 31, 2021 | +4.1% |
| Sep 30, 2021 | -13.0% |
| Oct 29, 2021 | +3.7% |
| Nov 30, 2021 | +11.0% |
| Dec 31, 2021 | -7.8% |
| Jan 31, 2022 | -3.0% |
| Feb 28, 2022 | +2.1% |
| Mar 31, 2022 | +8.9% |
| Apr 29, 2022 | +13.4% |
| May 31, 2022 | +13.6% |
| Jun 30, 2022 | -3.0% |
| Jul 29, 2022 | +0.1% |
| Aug 31, 2022 | +12.9% |
| Sep 30, 2022 | +4.7% |
| Oct 31, 2022 | +9.0% |
| Nov 30, 2022 | -0.2% |
| Dec 30, 2022 | +5.2% |
| Jan 31, 2023 | -22.2% |
| Feb 28, 2023 | -1.5% |
| Mar 31, 2023 | -0.6% |
| Apr 28, 2023 | +4.7% |
| May 31, 2023 | -1.5% |
| Jun 30, 2023 | -7.1% |
| Jul 31, 2023 | -8.0% |
| Aug 31, 2023 | +4.8% |
| Sep 29, 2023 | +0.4% |
| Oct 31, 2023 | +0.2% |
| Nov 30, 2023 | +5.3% |
| Dec 29, 2023 | -5.7% |
| Jan 31, 2024 | +5.6% |
| Feb 29, 2024 | +18.3% |
| Mar 28, 2024 | -0.5% |
| Apr 30, 2024 | -14.8% |
| May 31, 2024 | +6.3% |
| Jun 28, 2024 | -2.1% |
| Jul 31, 2024 | -8.7% |
| Aug 30, 2024 | +1.2% |
| Sep 30, 2024 | +2.9% |
| Oct 31, 2024 | +6.4% |
| Nov 29, 2024 | +9.2% |
| Dec 31, 2024 | -1.0% |
| Jan 31, 2025 | +7.1% |
| Feb 28, 2025 | -7.6% |
| Mar 31, 2025 | -4.3% |
| Apr 30, 2025 | +10.6% |
| May 30, 2025 | +6.2% |
| Jun 30, 2025 | +4.1% |
| Jul 31, 2025 | +10.8% |
| Aug 29, 2025 | -3.7% |
| Sep 30, 2025 | +19.0% |
| Oct 31, 2025 | +8.4% |
| Nov 28, 2025 | -11.3% |
| Dec 31, 2025 | -2.7% |
| Jan 30, 2026 | +14.8% |
| Feb 27, 2026 | -5.0% |
| Mar 31, 2026 | -5.7% |
| Apr 30, 2026 | +21.7% |
| May 29, 2026 | +12.7% |
| Jun 30, 2026 | +13.1% |
| Jul 31, 2026 | -26.2% |
| Aug 31, 2026 | -15.5% |
| Sep 30, 2026 | +20.0% |
| Oct 16, 2026 | -3.9% |
Leaders in trend: 30% Bearish
The share of the 50 strongest stocks in the pool closing above their 50-day average. The leaders are what the strategies hold; a falling share means the strongest trends are breaking.
- The indicator (blue line)
- SPY, the S&P 500, on its own scale
- Bullish zone (at or above 70%)
- Bearish zone (at or below 40%)
- A Hindenburg Omen day
Show this chart’s numbers as a table
| Month end | Value |
|---|---|
| Oct 31, 2017 | 74% |
| Nov 30, 2017 | 62% |
| Dec 29, 2017 | 54% |
| Jan 31, 2018 | 70% |
| Feb 28, 2018 | 78% |
| Mar 29, 2018 | 44% |
| Apr 30, 2018 | 44% |
| May 31, 2018 | 82% |
| Jun 29, 2018 | 58% |
| Jul 31, 2018 | 46% |
| Aug 31, 2018 | 82% |
| Sep 28, 2018 | 80% |
| Oct 31, 2018 | 14% |
| Nov 30, 2018 | 52% |
| Dec 31, 2018 | 32% |
| Jan 31, 2019 | 78% |
| Feb 28, 2019 | 92% |
| Mar 29, 2019 | 84% |
| Apr 30, 2019 | 64% |
| May 31, 2019 | 54% |
| Jun 28, 2019 | 80% |
| Jul 31, 2019 | 78% |
| Aug 30, 2019 | 56% |
| Sep 30, 2019 | 42% |
| Oct 31, 2019 | 48% |
| Nov 29, 2019 | 86% |
| Dec 31, 2019 | 90% |
| Jan 31, 2020 | 62% |
| Feb 28, 2020 | 30% |
| Mar 31, 2020 | 34% |
| Apr 30, 2020 | 88% |
| May 29, 2020 | 98% |
| Jun 30, 2020 | 92% |
| Jul 31, 2020 | 92% |
| Aug 31, 2020 | 72% |
| Sep 30, 2020 | 74% |
| Oct 30, 2020 | 32% |
| Nov 30, 2020 | 86% |
| Dec 31, 2020 | 80% |
| Jan 29, 2021 | 84% |
| Feb 26, 2021 | 48% |
| Mar 31, 2021 | 32% |
| Apr 30, 2021 | 48% |
| May 28, 2021 | 68% |
| Jun 30, 2021 | 66% |
| Jul 30, 2021 | 42% |
| Aug 31, 2021 | 64% |
| Sep 30, 2021 | 38% |
| Oct 29, 2021 | 72% |
| Nov 30, 2021 | 48% |
| Dec 31, 2021 | 34% |
| Jan 31, 2022 | 34% |
| Feb 28, 2022 | 56% |
| Mar 31, 2022 | 90% |
| Apr 29, 2022 | 44% |
| May 31, 2022 | 72% |
| Jun 30, 2022 | 4% |
| Jul 29, 2022 | 62% |
| Aug 31, 2022 | 86% |
| Sep 30, 2022 | 18% |
| Oct 31, 2022 | 78% |
| Nov 30, 2022 | 88% |
| Dec 30, 2022 | 32% |
| Jan 31, 2023 | 52% |
| Feb 28, 2023 | 40% |
| Mar 31, 2023 | 68% |
| Apr 28, 2023 | 72% |
| May 31, 2023 | 56% |
| Jun 30, 2023 | 84% |
| Jul 31, 2023 | 92% |
| Aug 31, 2023 | 60% |
| Sep 29, 2023 | 22% |
| Oct 31, 2023 | 24% |
| Nov 30, 2023 | 86% |
| Dec 29, 2023 | 96% |
| Jan 31, 2024 | 64% |
| Feb 29, 2024 | 82% |
| Mar 28, 2024 | 82% |
| Apr 30, 2024 | 38% |
| May 31, 2024 | 62% |
| Jun 28, 2024 | 56% |
| Jul 31, 2024 | 44% |
| Aug 30, 2024 | 74% |
| Sep 30, 2024 | 90% |
| Oct 31, 2024 | 74% |
| Nov 29, 2024 | 80% |
| Dec 31, 2024 | 36% |
| Jan 31, 2025 | 66% |
| Feb 28, 2025 | 38% |
| Mar 31, 2025 | 32% |
| Apr 30, 2025 | 58% |
| May 30, 2025 | 94% |
| Jun 30, 2025 | 96% |
| Jul 31, 2025 | 78% |
| Aug 29, 2025 | 68% |
| Sep 30, 2025 | 84% |
| Oct 31, 2025 | 78% |
| Nov 28, 2025 | 46% |
| Dec 31, 2025 | 52% |
| Jan 30, 2026 | 70% |
| Feb 27, 2026 | 64% |
| Mar 31, 2026 | 44% |
| Apr 30, 2026 | 88% |
| May 29, 2026 | 88% |
| Jun 30, 2026 | 72% |
| Jul 31, 2026 | 6% |
| Aug 31, 2026 | 26% |
| Sep 30, 2026 | 76% |
| Oct 16, 2026 | 30% |
Leaders' pullback: -26.1% Bearish
The median fall of the 50 strongest stocks from their 52-week closing high. Near zero, the leaders are at their highs; a deep median fall means even the strongest have given back a lot.
- The indicator (blue line)
- SPY, the S&P 500, on its own scale
- Bullish zone (at or above -10.0%)
- Bearish zone (at or below -20.0%)
- A Hindenburg Omen day
Show this chart’s numbers as a table
| Month end | Value |
|---|---|
| Oct 31, 2017 | -2.7% |
| Nov 30, 2017 | -7.4% |
| Dec 29, 2017 | -8.0% |
| Jan 31, 2018 | -4.9% |
| Feb 28, 2018 | -5.6% |
| Mar 29, 2018 | -10.4% |
| Apr 30, 2018 | -9.0% |
| May 31, 2018 | -3.4% |
| Jun 29, 2018 | -10.9% |
| Jul 31, 2018 | -9.0% |
| Aug 31, 2018 | -2.4% |
| Sep 28, 2018 | -3.1% |
| Oct 31, 2018 | -18.0% |
| Nov 30, 2018 | -14.1% |
| Dec 31, 2018 | -17.0% |
| Jan 31, 2019 | -4.1% |
| Feb 28, 2019 | -2.4% |
| Mar 29, 2019 | -4.4% |
| Apr 30, 2019 | -5.0% |
| May 31, 2019 | -7.4% |
| Jun 28, 2019 | -4.9% |
| Jul 31, 2019 | -4.5% |
| Aug 30, 2019 | -6.7% |
| Sep 30, 2019 | -10.4% |
| Oct 31, 2019 | -8.9% |
| Nov 29, 2019 | -5.3% |
| Dec 31, 2019 | -2.0% |
| Jan 31, 2020 | -5.7% |
| Feb 28, 2020 | -14.8% |
| Mar 31, 2020 | -17.3% |
| Apr 30, 2020 | -7.3% |
| May 29, 2020 | -6.8% |
| Jun 30, 2020 | -3.0% |
| Jul 31, 2020 | -2.9% |
| Aug 31, 2020 | -7.4% |
| Sep 30, 2020 | -10.3% |
| Oct 30, 2020 | -20.9% |
| Nov 30, 2020 | -8.1% |
| Dec 31, 2020 | -12.1% |
| Jan 29, 2021 | -14.2% |
| Feb 26, 2021 | -33.0% |
| Mar 31, 2021 | -32.0% |
| Apr 30, 2021 | -27.5% |
| May 28, 2021 | -17.7% |
| Jun 30, 2021 | -14.4% |
| Jul 30, 2021 | -19.9% |
| Aug 31, 2021 | -17.4% |
| Sep 30, 2021 | -13.8% |
| Oct 29, 2021 | -7.5% |
| Nov 30, 2021 | -16.0% |
| Dec 31, 2021 | -12.8% |
| Jan 31, 2022 | -16.9% |
| Feb 28, 2022 | -5.1% |
| Mar 31, 2022 | -5.9% |
| Apr 29, 2022 | -11.7% |
| May 31, 2022 | -2.8% |
| Jun 30, 2022 | -26.5% |
| Jul 29, 2022 | -15.3% |
| Aug 31, 2022 | -10.4% |
| Sep 30, 2022 | -18.8% |
| Oct 31, 2022 | -2.8% |
| Nov 30, 2022 | -4.6% |
| Dec 30, 2022 | -11.6% |
| Jan 31, 2023 | -6.6% |
| Feb 28, 2023 | -9.8% |
| Mar 31, 2023 | -5.6% |
| Apr 28, 2023 | -3.1% |
| May 31, 2023 | -6.5% |
| Jun 30, 2023 | -1.3% |
| Jul 31, 2023 | -2.9% |
| Aug 31, 2023 | -7.4% |
| Sep 29, 2023 | -9.9% |
| Oct 31, 2023 | -16.8% |
| Nov 30, 2023 | -4.2% |
| Dec 29, 2023 | -5.1% |
| Jan 31, 2024 | -5.8% |
| Feb 29, 2024 | -1.5% |
| Mar 28, 2024 | -5.3% |
| Apr 30, 2024 | -12.9% |
| May 31, 2024 | -7.3% |
| Jun 28, 2024 | -9.2% |
| Jul 31, 2024 | -13.0% |
| Aug 30, 2024 | -5.8% |
| Sep 30, 2024 | -3.9% |
| Oct 31, 2024 | -8.1% |
| Nov 29, 2024 | -3.6% |
| Dec 31, 2024 | -14.7% |
| Jan 31, 2025 | -13.0% |
| Feb 28, 2025 | -21.0% |
| Mar 31, 2025 | -27.2% |
| Apr 30, 2025 | -14.8% |
| May 30, 2025 | -9.3% |
| Jun 30, 2025 | -5.1% |
| Jul 31, 2025 | -7.2% |
| Aug 29, 2025 | -9.5% |
| Sep 30, 2025 | -9.9% |
| Oct 31, 2025 | -13.8% |
| Nov 28, 2025 | -19.8% |
| Dec 31, 2025 | -13.6% |
| Jan 30, 2026 | -17.1% |
| Feb 27, 2026 | -9.4% |
| Mar 31, 2026 | -18.4% |
| Apr 30, 2026 | -6.4% |
| May 29, 2026 | -9.0% |
| Jun 30, 2026 | -13.3% |
| Jul 31, 2026 | -34.8% |
| Aug 31, 2026 | -28.7% |
| Sep 30, 2026 | -15.1% |
| Oct 16, 2026 | -26.1% |
Pool trend: 53% Neutral
The share of the pool closing above its 200-day average (the 50-day share is shown alongside). Whether most of the strategies' universe is in a long-term rising trend.
- The indicator (blue line)
- SPY, the S&P 500, on its own scale
- Bullish zone (at or above 60%)
- Bearish zone (at or below 40%)
- A Hindenburg Omen day
Show this chart’s numbers as a table
| Month end | Value |
|---|---|
| Oct 31, 2017 | 70% |
| Nov 30, 2017 | 77% |
| Dec 29, 2017 | 80% |
| Jan 31, 2018 | 84% |
| Feb 28, 2018 | 70% |
| Mar 29, 2018 | 62% |
| Apr 30, 2018 | 58% |
| May 31, 2018 | 61% |
| Jun 29, 2018 | 60% |
| Jul 31, 2018 | 68% |
| Aug 31, 2018 | 69% |
| Sep 28, 2018 | 67% |
| Oct 31, 2018 | 43% |
| Nov 30, 2018 | 48% |
| Dec 31, 2018 | 27% |
| Jan 31, 2019 | 48% |
| Feb 28, 2019 | 63% |
| Mar 29, 2019 | 63% |
| Apr 30, 2019 | 72% |
| May 31, 2019 | 53% |
| Jun 28, 2019 | 76% |
| Jul 31, 2019 | 75% |
| Aug 30, 2019 | 62% |
| Sep 30, 2019 | 68% |
| Oct 31, 2019 | 68% |
| Nov 29, 2019 | 74% |
| Dec 31, 2019 | 80% |
| Jan 31, 2020 | 72% |
| Feb 28, 2020 | 35% |
| Mar 31, 2020 | 16% |
| Apr 30, 2020 | 38% |
| May 29, 2020 | 57% |
| Jun 30, 2020 | 55% |
| Jul 31, 2020 | 66% |
| Aug 31, 2020 | 74% |
| Sep 30, 2020 | 74% |
| Oct 30, 2020 | 69% |
| Nov 30, 2020 | 91% |
| Dec 31, 2020 | 90% |
| Jan 29, 2021 | 88% |
| Feb 26, 2021 | 83% |
| Mar 31, 2021 | 89% |
| Apr 30, 2021 | 90% |
| May 28, 2021 | 84% |
| Jun 30, 2021 | 89% |
| Jul 30, 2021 | 80% |
| Aug 31, 2021 | 74% |
| Sep 30, 2021 | 63% |
| Oct 29, 2021 | 71% |
| Nov 30, 2021 | 57% |
| Dec 31, 2021 | 67% |
| Jan 31, 2022 | 49% |
| Feb 28, 2022 | 43% |
| Mar 31, 2022 | 52% |
| Apr 29, 2022 | 37% |
| May 31, 2022 | 36% |
| Jun 30, 2022 | 25% |
| Jul 29, 2022 | 35% |
| Aug 31, 2022 | 32% |
| Sep 30, 2022 | 16% |
| Oct 31, 2022 | 39% |
| Nov 30, 2022 | 63% |
| Dec 30, 2022 | 49% |
| Jan 31, 2023 | 72% |
| Feb 28, 2023 | 58% |
| Mar 31, 2023 | 64% |
| Apr 28, 2023 | 60% |
| May 31, 2023 | 50% |
| Jun 30, 2023 | 70% |
| Jul 31, 2023 | 77% |
| Aug 31, 2023 | 64% |
| Sep 29, 2023 | 51% |
| Oct 31, 2023 | 39% |
| Nov 30, 2023 | 66% |
| Dec 29, 2023 | 81% |
| Jan 31, 2024 | 71% |
| Feb 29, 2024 | 78% |
| Mar 28, 2024 | 86% |
| Apr 30, 2024 | 73% |
| May 31, 2024 | 72% |
| Jun 28, 2024 | 71% |
| Jul 31, 2024 | 76% |
| Aug 30, 2024 | 76% |
| Sep 30, 2024 | 77% |
| Oct 31, 2024 | 69% |
| Nov 29, 2024 | 76% |
| Dec 31, 2024 | 61% |
| Jan 31, 2025 | 67% |
| Feb 28, 2025 | 62% |
| Mar 31, 2025 | 46% |
| Apr 30, 2025 | 44% |
| May 30, 2025 | 58% |
| Jun 30, 2025 | 67% |
| Jul 31, 2025 | 68% |
| Aug 29, 2025 | 73% |
| Sep 30, 2025 | 71% |
| Oct 31, 2025 | 66% |
| Nov 28, 2025 | 64% |
| Dec 31, 2025 | 65% |
| Jan 30, 2026 | 68% |
| Feb 27, 2026 | 65% |
| Mar 31, 2026 | 53% |
| Apr 30, 2026 | 62% |
| May 29, 2026 | 64% |
| Jun 30, 2026 | 63% |
| Jul 31, 2026 | 65% |
| Aug 31, 2026 | 68% |
| Sep 30, 2026 | 46% |
| Oct 16, 2026 | 53% |
Net new highs: +3.0% Bullish
Stocks in the pool closing at a 52-week high minus those at a 52-week low, as a share of the pool. More new highs than lows means the pool is still making progress; the reverse is a sign of broad weakness.
- The indicator (blue line)
- SPY, the S&P 500, on its own scale
- Bullish zone (at or above +3.0%)
- Bearish zone (at or below -3.0%)
- A Hindenburg Omen day
Show this chart’s numbers as a table
| Month end | Value |
|---|---|
| Oct 31, 2017 | +9.0% |
| Nov 30, 2017 | +18.4% |
| Dec 29, 2017 | +2.6% |
| Jan 31, 2018 | +4.0% |
| Feb 28, 2018 | -1.2% |
| Mar 29, 2018 | +1.2% |
| Apr 30, 2018 | -0.6% |
| May 31, 2018 | +1.2% |
| Jun 29, 2018 | +0.4% |
| Jul 31, 2018 | +5.2% |
| Aug 31, 2018 | +9.6% |
| Sep 28, 2018 | +4.2% |
| Oct 31, 2018 | +0.6% |
| Nov 30, 2018 | +6.8% |
| Dec 31, 2018 | +0.2% |
| Jan 31, 2019 | +8.4% |
| Feb 28, 2019 | +8.8% |
| Mar 29, 2019 | +11.8% |
| Apr 30, 2019 | +13.2% |
| May 31, 2019 | -5.6% |
| Jun 28, 2019 | +6.2% |
| Jul 31, 2019 | +2.6% |
| Aug 30, 2019 | +5.8% |
| Sep 30, 2019 | +3.8% |
| Oct 31, 2019 | +5.2% |
| Nov 29, 2019 | +3.4% |
| Dec 31, 2019 | +5.0% |
| Jan 31, 2020 | -1.4% |
| Feb 28, 2020 | -10.4% |
| Mar 31, 2020 | -0.2% |
| Apr 30, 2020 | +1.6% |
| May 29, 2020 | +9.8% |
| Jun 30, 2020 | +8.4% |
| Jul 31, 2020 | +11.8% |
| Aug 31, 2020 | +8.2% |
| Sep 30, 2020 | +4.2% |
| Oct 30, 2020 | +0.2% |
| Nov 30, 2020 | +8.8% |
| Dec 31, 2020 | +11.4% |
| Jan 29, 2021 | +1.8% |
| Feb 26, 2021 | +1.6% |
| Mar 31, 2021 | +2.0% |
| Apr 30, 2021 | +3.6% |
| May 28, 2021 | +7.0% |
| Jun 30, 2021 | +3.8% |
| Jul 30, 2021 | +12.6% |
| Aug 31, 2021 | +6.0% |
| Sep 30, 2021 | 0.0% |
| Oct 29, 2021 | +12.6% |
| Nov 30, 2021 | -9.4% |
| Dec 31, 2021 | +8.4% |
| Jan 31, 2022 | +3.4% |
| Feb 28, 2022 | +5.2% |
| Mar 31, 2022 | +1.8% |
| Apr 29, 2022 | -12.4% |
| May 31, 2022 | +1.0% |
| Jun 30, 2022 | -6.8% |
| Jul 29, 2022 | +1.0% |
| Aug 31, 2022 | -3.2% |
| Sep 30, 2022 | -20.8% |
| Oct 31, 2022 | +3.0% |
| Nov 30, 2022 | +7.6% |
| Dec 30, 2022 | +0.2% |
| Jan 31, 2023 | +3.8% |
| Feb 28, 2023 | -1.0% |
| Mar 31, 2023 | +7.0% |
| Apr 28, 2023 | +5.8% |
| May 31, 2023 | -1.2% |
| Jun 30, 2023 | +17.0% |
| Jul 31, 2023 | +8.2% |
| Aug 31, 2023 | +5.2% |
| Sep 29, 2023 | -0.4% |
| Oct 31, 2023 | -0.2% |
| Nov 30, 2023 | +10.8% |
| Dec 29, 2023 | +3.8% |
| Jan 31, 2024 | +1.8% |
| Feb 29, 2024 | +14.6% |
| Mar 28, 2024 | +18.6% |
| Apr 30, 2024 | +0.2% |
| May 31, 2024 | +5.8% |
| Jun 28, 2024 | +1.6% |
| Jul 31, 2024 | +9.2% |
| Aug 30, 2024 | +22.2% |
| Sep 30, 2024 | +8.4% |
| Oct 31, 2024 | +1.6% |
| Nov 29, 2024 | +11.0% |
| Dec 31, 2024 | -0.2% |
| Jan 31, 2025 | +2.4% |
| Feb 28, 2025 | +6.2% |
| Mar 31, 2025 | +1.4% |
| Apr 30, 2025 | +3.6% |
| May 30, 2025 | +5.4% |
| Jun 30, 2025 | +10.8% |
| Jul 31, 2025 | +1.6% |
| Aug 29, 2025 | +5.4% |
| Sep 30, 2025 | +9.6% |
| Oct 31, 2025 | +2.8% |
| Nov 28, 2025 | +7.8% |
| Dec 31, 2025 | -0.4% |
| Jan 30, 2026 | +1.4% |
| Feb 27, 2026 | +10.8% |
| Mar 31, 2026 | +2.0% |
| Apr 30, 2026 | +10.2% |
| May 29, 2026 | +5.4% |
| Jun 30, 2026 | +4.0% |
| Jul 31, 2026 | 0.0% |
| Aug 31, 2026 | +0.4% |
| Sep 30, 2026 | -2.4% |
| Oct 16, 2026 | +3.0% |
Leadership: -6.8% Bearish
The leaders' median return over the past month minus the median return of the whole pool. Positive: the strongest stocks keep outpacing the rest, which is what momentum strategies need.
- The indicator (blue line)
- SPY, the S&P 500, on its own scale
- Bullish zone (at or above +2.0%)
- Bearish zone (at or below -2.0%)
- A Hindenburg Omen day
Show this chart’s numbers as a table
| Month end | Value |
|---|---|
| Oct 31, 2017 | +1.3% |
| Nov 30, 2017 | -1.7% |
| Dec 29, 2017 | -2.8% |
| Jan 31, 2018 | +4.0% |
| Feb 28, 2018 | +2.8% |
| Mar 29, 2018 | -1.3% |
| Apr 30, 2018 | -0.1% |
| May 31, 2018 | +5.4% |
| Jun 29, 2018 | -3.0% |
| Jul 31, 2018 | -3.2% |
| Aug 31, 2018 | +5.4% |
| Sep 28, 2018 | +2.1% |
| Oct 31, 2018 | -3.7% |
| Nov 30, 2018 | -5.8% |
| Dec 31, 2018 | +2.1% |
| Jan 31, 2019 | +0.0% |
| Feb 28, 2019 | +3.2% |
| Mar 29, 2019 | +1.0% |
| Apr 30, 2019 | -2.9% |
| May 31, 2019 | +5.3% |
| Jun 28, 2019 | -0.6% |
| Jul 31, 2019 | +1.3% |
| Aug 30, 2019 | +1.5% |
| Sep 30, 2019 | -7.6% |
| Oct 31, 2019 | +0.5% |
| Nov 29, 2019 | +2.2% |
| Dec 31, 2019 | -0.3% |
| Jan 31, 2020 | +3.4% |
| Feb 28, 2020 | +4.2% |
| Mar 31, 2020 | +7.9% |
| Apr 30, 2020 | +0.2% |
| May 29, 2020 | +6.7% |
| Jun 30, 2020 | +8.5% |
| Jul 31, 2020 | +6.4% |
| Aug 31, 2020 | -1.0% |
| Sep 30, 2020 | +4.2% |
| Oct 30, 2020 | -7.7% |
| Nov 30, 2020 | +10.1% |
| Dec 31, 2020 | +10.0% |
| Jan 29, 2021 | +17.0% |
| Feb 26, 2021 | -12.1% |
| Mar 31, 2021 | -11.8% |
| Apr 30, 2021 | -10.5% |
| May 28, 2021 | -3.4% |
| Jun 30, 2021 | +6.5% |
| Jul 30, 2021 | -11.9% |
| Aug 31, 2021 | +1.9% |
| Sep 30, 2021 | -1.6% |
| Oct 29, 2021 | +4.6% |
| Nov 30, 2021 | +1.6% |
| Dec 31, 2021 | -9.1% |
| Jan 31, 2022 | -3.6% |
| Feb 28, 2022 | +3.0% |
| Mar 31, 2022 | +3.9% |
| Apr 29, 2022 | +4.6% |
| May 31, 2022 | +7.8% |
| Jun 30, 2022 | -8.3% |
| Jul 29, 2022 | -2.7% |
| Aug 31, 2022 | +8.1% |
| Sep 30, 2022 | +0.1% |
| Oct 31, 2022 | +3.8% |
| Nov 30, 2022 | -5.3% |
| Dec 30, 2022 | -0.7% |
| Jan 31, 2023 | -5.4% |
| Feb 28, 2023 | -3.0% |
| Mar 31, 2023 | -0.3% |
| Apr 28, 2023 | +0.8% |
| May 31, 2023 | +2.9% |
| Jun 30, 2023 | +3.3% |
| Jul 31, 2023 | +1.3% |
| Aug 31, 2023 | -0.6% |
| Sep 29, 2023 | -2.1% |
| Oct 31, 2023 | -2.5% |
| Nov 30, 2023 | +3.6% |
| Dec 29, 2023 | -1.2% |
| Jan 31, 2024 | +0.6% |
| Feb 29, 2024 | +8.7% |
| Mar 28, 2024 | +0.5% |
| Apr 30, 2024 | -3.7% |
| May 31, 2024 | +2.8% |
| Jun 28, 2024 | -2.9% |
| Jul 31, 2024 | -7.3% |
| Aug 30, 2024 | +4.1% |
| Sep 30, 2024 | +3.8% |
| Oct 31, 2024 | +3.2% |
| Nov 29, 2024 | +11.8% |
| Dec 31, 2024 | -3.9% |
| Jan 31, 2025 | +4.7% |
| Feb 28, 2025 | -4.6% |
| Mar 31, 2025 | -6.0% |
| Apr 30, 2025 | +8.8% |
| May 30, 2025 | +14.7% |
| Jun 30, 2025 | +5.4% |
| Jul 31, 2025 | +11.3% |
| Aug 29, 2025 | -3.1% |
| Sep 30, 2025 | +14.7% |
| Oct 31, 2025 | +7.6% |
| Nov 28, 2025 | -10.4% |
| Dec 31, 2025 | -1.1% |
| Jan 30, 2026 | +10.1% |
| Feb 27, 2026 | -5.8% |
| Mar 31, 2026 | -4.5% |
| Apr 30, 2026 | +26.3% |
| May 29, 2026 | +23.3% |
| Jun 30, 2026 | +2.6% |
| Jul 31, 2026 | -22.3% |
| Aug 31, 2026 | +0.9% |
| Sep 30, 2026 | +15.2% |
| Oct 16, 2026 | -6.8% |
Rotation: 40% Bearish
The share of today's 50 strongest stocks that were not among the 50 strongest a month ago. Low: the leadership is stable. High: leadership is churning, which tends to mean more trading and whipsaws for momentum strategies.
- The indicator (blue line)
- SPY, the S&P 500, on its own scale
- Bullish zone (at or below 20%)
- Bearish zone (at or above 40%)
- A Hindenburg Omen day
Show this chart’s numbers as a table
| Month end | Value |
|---|---|
| Oct 31, 2017 | 38% |
| Nov 30, 2017 | 48% |
| Dec 29, 2017 | 30% |
| Jan 31, 2018 | 30% |
| Feb 28, 2018 | 36% |
| Mar 29, 2018 | 22% |
| Apr 30, 2018 | 34% |
| May 31, 2018 | 42% |
| Jun 29, 2018 | 38% |
| Jul 31, 2018 | 48% |
| Aug 31, 2018 | 38% |
| Sep 28, 2018 | 34% |
| Oct 31, 2018 | 36% |
| Nov 30, 2018 | 44% |
| Dec 31, 2018 | 46% |
| Jan 31, 2019 | 32% |
| Feb 28, 2019 | 38% |
| Mar 29, 2019 | 36% |
| Apr 30, 2019 | 30% |
| May 31, 2019 | 38% |
| Jun 28, 2019 | 28% |
| Jul 31, 2019 | 32% |
| Aug 30, 2019 | 38% |
| Sep 30, 2019 | 38% |
| Oct 31, 2019 | 50% |
| Nov 29, 2019 | 28% |
| Dec 31, 2019 | 36% |
| Jan 31, 2020 | 32% |
| Feb 28, 2020 | 36% |
| Mar 31, 2020 | 48% |
| Apr 30, 2020 | 44% |
| May 29, 2020 | 36% |
| Jun 30, 2020 | 34% |
| Jul 31, 2020 | 26% |
| Aug 31, 2020 | 28% |
| Sep 30, 2020 | 28% |
| Oct 30, 2020 | 20% |
| Nov 30, 2020 | 30% |
| Dec 31, 2020 | 26% |
| Jan 29, 2021 | 24% |
| Feb 26, 2021 | 38% |
| Mar 31, 2021 | 28% |
| Apr 30, 2021 | 26% |
| May 28, 2021 | 30% |
| Jun 30, 2021 | 30% |
| Jul 30, 2021 | 28% |
| Aug 31, 2021 | 34% |
| Sep 30, 2021 | 38% |
| Oct 29, 2021 | 30% |
| Nov 30, 2021 | 30% |
| Dec 31, 2021 | 32% |
| Jan 31, 2022 | 34% |
| Feb 28, 2022 | 50% |
| Mar 31, 2022 | 38% |
| Apr 29, 2022 | 30% |
| May 31, 2022 | 36% |
| Jun 30, 2022 | 26% |
| Jul 29, 2022 | 24% |
| Aug 31, 2022 | 18% |
| Sep 30, 2022 | 22% |
| Oct 31, 2022 | 34% |
| Nov 30, 2022 | 26% |
| Dec 30, 2022 | 22% |
| Jan 31, 2023 | 48% |
| Feb 28, 2023 | 38% |
| Mar 31, 2023 | 40% |
| Apr 28, 2023 | 60% |
| May 31, 2023 | 32% |
| Jun 30, 2023 | 40% |
| Jul 31, 2023 | 34% |
| Aug 31, 2023 | 36% |
| Sep 29, 2023 | 46% |
| Oct 31, 2023 | 36% |
| Nov 30, 2023 | 44% |
| Dec 29, 2023 | 44% |
| Jan 31, 2024 | 28% |
| Feb 29, 2024 | 28% |
| Mar 28, 2024 | 34% |
| Apr 30, 2024 | 24% |
| May 31, 2024 | 36% |
| Jun 28, 2024 | 36% |
| Jul 31, 2024 | 30% |
| Aug 30, 2024 | 28% |
| Sep 30, 2024 | 30% |
| Oct 31, 2024 | 36% |
| Nov 29, 2024 | 38% |
| Dec 31, 2024 | 20% |
| Jan 31, 2025 | 32% |
| Feb 28, 2025 | 28% |
| Mar 31, 2025 | 34% |
| Apr 30, 2025 | 36% |
| May 30, 2025 | 36% |
| Jun 30, 2025 | 22% |
| Jul 31, 2025 | 18% |
| Aug 29, 2025 | 22% |
| Sep 30, 2025 | 28% |
| Oct 31, 2025 | 28% |
| Nov 28, 2025 | 32% |
| Dec 31, 2025 | 38% |
| Jan 30, 2026 | 20% |
| Feb 27, 2026 | 24% |
| Mar 31, 2026 | 28% |
| Apr 30, 2026 | 26% |
| May 29, 2026 | 28% |
| Jun 30, 2026 | 24% |
| Jul 31, 2026 | 20% |
| Aug 31, 2026 | 26% |
| Sep 30, 2026 | 24% |
| Oct 16, 2026 | 40% |
Crowding: 60% Bearish
The largest single sector's share of the 50 strongest stocks. Low: momentum is spread across the market. High: the strongest trends sit in one sector, so one sector's reversal would hit them together.
- The indicator (blue line)
- SPY, the S&P 500, on its own scale
- Bullish zone (at or below 30%)
- Bearish zone (at or above 50%)
- A Hindenburg Omen day
Show this chart’s numbers as a table
| Month end | Value |
|---|---|
| Oct 31, 2017 | 28% |
| Nov 30, 2017 | 36% |
| Dec 29, 2017 | 28% |
| Jan 31, 2018 | 24% |
| Feb 28, 2018 | 24% |
| Mar 29, 2018 | 22% |
| Apr 30, 2018 | 30% |
| May 31, 2018 | 22% |
| Jun 29, 2018 | 30% |
| Jul 31, 2018 | 28% |
| Aug 31, 2018 | 24% |
| Sep 28, 2018 | 28% |
| Oct 31, 2018 | 24% |
| Nov 30, 2018 | 28% |
| Dec 31, 2018 | 34% |
| Jan 31, 2019 | 34% |
| Feb 28, 2019 | 34% |
| Mar 29, 2019 | 48% |
| Apr 30, 2019 | 46% |
| May 31, 2019 | 52% |
| Jun 28, 2019 | 46% |
| Jul 31, 2019 | 50% |
| Aug 30, 2019 | 40% |
| Sep 30, 2019 | 36% |
| Oct 31, 2019 | 48% |
| Nov 29, 2019 | 48% |
| Dec 31, 2019 | 50% |
| Jan 31, 2020 | 48% |
| Feb 28, 2020 | 48% |
| Mar 31, 2020 | 38% |
| Apr 30, 2020 | 30% |
| May 29, 2020 | 38% |
| Jun 30, 2020 | 38% |
| Jul 31, 2020 | 28% |
| Aug 31, 2020 | 30% |
| Sep 30, 2020 | 30% |
| Oct 30, 2020 | 40% |
| Nov 30, 2020 | 32% |
| Dec 31, 2020 | 34% |
| Jan 29, 2021 | 32% |
| Feb 26, 2021 | 26% |
| Mar 31, 2021 | 32% |
| Apr 30, 2021 | 40% |
| May 28, 2021 | 32% |
| Jun 30, 2021 | 24% |
| Jul 30, 2021 | 28% |
| Aug 31, 2021 | 26% |
| Sep 30, 2021 | 22% |
| Oct 29, 2021 | 20% |
| Nov 30, 2021 | 26% |
| Dec 31, 2021 | 26% |
| Jan 31, 2022 | 34% |
| Feb 28, 2022 | 28% |
| Mar 31, 2022 | 42% |
| Apr 29, 2022 | 50% |
| May 31, 2022 | 48% |
| Jun 30, 2022 | 64% |
| Jul 29, 2022 | 58% |
| Aug 31, 2022 | 56% |
| Sep 30, 2022 | 50% |
| Oct 31, 2022 | 48% |
| Nov 30, 2022 | 60% |
| Dec 30, 2022 | 62% |
| Jan 31, 2023 | 38% |
| Feb 28, 2023 | 34% |
| Mar 31, 2023 | 24% |
| Apr 28, 2023 | 24% |
| May 31, 2023 | 32% |
| Jun 30, 2023 | 36% |
| Jul 31, 2023 | 34% |
| Aug 31, 2023 | 32% |
| Sep 29, 2023 | 32% |
| Oct 31, 2023 | 42% |
| Nov 30, 2023 | 44% |
| Dec 29, 2023 | 42% |
| Jan 31, 2024 | 44% |
| Feb 29, 2024 | 46% |
| Mar 28, 2024 | 36% |
| Apr 30, 2024 | 32% |
| May 31, 2024 | 22% |
| Jun 28, 2024 | 30% |
| Jul 31, 2024 | 38% |
| Aug 30, 2024 | 26% |
| Sep 30, 2024 | 26% |
| Oct 31, 2024 | 28% |
| Nov 29, 2024 | 30% |
| Dec 31, 2024 | 30% |
| Jan 31, 2025 | 30% |
| Feb 28, 2025 | 26% |
| Mar 31, 2025 | 20% |
| Apr 30, 2025 | 20% |
| May 30, 2025 | 34% |
| Jun 30, 2025 | 34% |
| Jul 31, 2025 | 34% |
| Aug 29, 2025 | 32% |
| Sep 30, 2025 | 36% |
| Oct 31, 2025 | 44% |
| Nov 28, 2025 | 38% |
| Dec 31, 2025 | 34% |
| Jan 30, 2026 | 38% |
| Feb 27, 2026 | 42% |
| Mar 31, 2026 | 44% |
| Apr 30, 2026 | 56% |
| May 29, 2026 | 64% |
| Jun 30, 2026 | 64% |
| Jul 31, 2026 | 76% |
| Aug 31, 2026 | 68% |
| Sep 30, 2026 | 58% |
| Oct 16, 2026 | 60% |
Whole market: every US stock over $5
The whole market read Firm (57 of 100): 2 of the 7 indicators bullish, 1 bearish. 51% of US stocks are above their 200-day average. SPY’s volatility is 10% a year. The score is up 7 points from a week ago.
The 7 indicators today
- Stocks above their 200-day average51%Neutral since Sep 14, 2026Above 60%, most stocks are in a long-term rising trend; below 40%, most are not.A week ago: 52%
- Stocks above their 50-day average33%Bearish since Sep 16, 2026The shorter-term version: it turns first, in both directions.A week ago: 33%
- Net new highs-0.2%Neutral since Oct 16, 2026Positive: more stocks breaking out than breaking down.A week ago: +0.4%
- Advancing stocks45%Neutral since Oct 12, 2026Whether the typical stock has been rising lately, whatever the index did.A week ago: 43%
- Typical stock-2.0%Neutral since Oct 15, 2026How an ordinary stock has done, rather than the largest companies that drive the index.A week ago: -2.0%
- S&P 500 trend+5.7%Bullish since Apr 8, 2026The index's own long-term trend.A week ago: +8.2%
- Volatility10%Bullish since Jul 10, 2026Calm markets (under 15%) tend to be rising ones; above 25% is a stressed market.A week ago: 10%
The score over time
The blue line is the score each day: every indicator counts the same, so it is 0 when all of them are bearish and 100 when all are bullish. The green band is the Strong zone (65 or more), the red band the Weak zone (35 or less). The grey line is SPY on its own scale, to show what the market was doing at the time; the dotted purple lines are the days the Hindenburg Omen fired.
- The score (blue line)
- SPY, the S&P 500, on its own scale
- Strong zone: 65 or more
- Weak zone: 35 or less
- A Hindenburg Omen day
Show this chart’s numbers as a table
| Month end | Value |
|---|---|
| Oct 31, 2017 | 86 |
| Nov 30, 2017 | 100 |
| Dec 29, 2017 | 93 |
| Jan 31, 2018 | 86 |
| Feb 28, 2018 | 29 |
| Mar 29, 2018 | 57 |
| Apr 30, 2018 | 50 |
| May 31, 2018 | 100 |
| Jun 29, 2018 | 71 |
| Jul 31, 2018 | 79 |
| Aug 31, 2018 | 93 |
| Sep 28, 2018 | 64 |
| Oct 31, 2018 | 14 |
| Nov 30, 2018 | 57 |
| Dec 31, 2018 | 7 |
| Jan 31, 2019 | 71 |
| Feb 28, 2019 | 93 |
| Mar 29, 2019 | 71 |
| Apr 30, 2019 | 93 |
| May 31, 2019 | 21 |
| Jun 28, 2019 | 100 |
| Jul 31, 2019 | 79 |
| Aug 30, 2019 | 50 |
| Sep 30, 2019 | 79 |
| Oct 31, 2019 | 93 |
| Nov 29, 2019 | 100 |
| Dec 31, 2019 | 100 |
| Jan 31, 2020 | 43 |
| Feb 28, 2020 | 7 |
| Mar 31, 2020 | 21 |
| Apr 30, 2020 | 57 |
| May 29, 2020 | 71 |
| Jun 30, 2020 | 50 |
| Jul 31, 2020 | 79 |
| Aug 31, 2020 | 79 |
| Sep 30, 2020 | 43 |
| Oct 30, 2020 | 43 |
| Nov 30, 2020 | 93 |
| Dec 31, 2020 | 100 |
| Jan 29, 2021 | 64 |
| Feb 26, 2021 | 79 |
| Mar 31, 2021 | 71 |
| Apr 30, 2021 | 93 |
| May 28, 2021 | 93 |
| Jun 30, 2021 | 71 |
| Jul 30, 2021 | 86 |
| Aug 31, 2021 | 86 |
| Sep 30, 2021 | 50 |
| Oct 29, 2021 | 79 |
| Nov 30, 2021 | 36 |
| Dec 31, 2021 | 79 |
| Jan 31, 2022 | 29 |
| Feb 28, 2022 | 57 |
| Mar 31, 2022 | 57 |
| Apr 29, 2022 | 7 |
| May 31, 2022 | 29 |
| Jun 30, 2022 | 7 |
| Jul 29, 2022 | 64 |
| Aug 31, 2022 | 21 |
| Sep 30, 2022 | 7 |
| Oct 31, 2022 | 64 |
| Nov 30, 2022 | 71 |
| Dec 30, 2022 | 43 |
| Jan 31, 2023 | 93 |
| Feb 28, 2023 | 64 |
| Mar 31, 2023 | 71 |
| Apr 28, 2023 | 71 |
| May 31, 2023 | 71 |
| Jun 30, 2023 | 93 |
| Jul 31, 2023 | 100 |
| Aug 31, 2023 | 86 |
| Sep 29, 2023 | 50 |
| Oct 31, 2023 | 29 |
| Nov 30, 2023 | 93 |
| Dec 29, 2023 | 100 |
| Jan 31, 2024 | 86 |
| Feb 29, 2024 | 86 |
| Mar 28, 2024 | 100 |
| Apr 30, 2024 | 71 |
| May 31, 2024 | 79 |
| Jun 28, 2024 | 79 |
| Jul 31, 2024 | 93 |
| Aug 30, 2024 | 93 |
| Sep 30, 2024 | 93 |
| Oct 31, 2024 | 64 |
| Nov 29, 2024 | 100 |
| Dec 31, 2024 | 50 |
| Jan 31, 2025 | 93 |
| Feb 28, 2025 | 57 |
| Mar 31, 2025 | 14 |
| Apr 30, 2025 | 43 |
| May 30, 2025 | 71 |
| Jun 30, 2025 | 93 |
| Jul 31, 2025 | 57 |
| Aug 29, 2025 | 100 |
| Sep 30, 2025 | 79 |
| Oct 31, 2025 | 71 |
| Nov 28, 2025 | 86 |
| Dec 31, 2025 | 64 |
| Jan 30, 2026 | 86 |
| Feb 27, 2026 | 79 |
| Mar 31, 2026 | 43 |
| Apr 30, 2026 | 100 |
| May 29, 2026 | 93 |
| Jun 30, 2026 | 93 |
| Jul 31, 2026 | 79 |
| Aug 31, 2026 | 71 |
| Sep 30, 2026 | 36 |
| Oct 16, 2026 | 57 |
What followed each band
| When the score was | Days | Separate spells | SPY over the next 3 months (average) | SPY’s worst fall in those 3 months (average) |
|---|---|---|---|---|
| Strong | 1,384 | 97 | +3.1% | -4.4% |
| Firm | 288 | 153 | +3.7% | -4.7% |
| Mixed | 113 | 91 | +4.4% | -4.8% |
| Soft | 201 | 108 | +4.0% | -5.6% |
| Weak | 275 | 53 | +6.8% | -6.5% |
| Every day (the baseline) | 2,261 | – | +3.8% | -4.8% |
How to read it. Each row takes every trading day the score was in that band since 2017 and asks what happened next: the average return over the following three months (63 trading days), and the average of the deepest drop along the way. The last row is every day, the baseline to compare with. “Separate spells” counts the distinct stretches the days come from: neighbouring days overlap, so a band with few spells rests on few real episodes.
What it shows. After Weak days (275 days in 53 separate spells), SPY’s worst fall over the next three months averaged -6.5%, against -4.8% from any day; its average return was +6.8%, against +3.8%. After Strong days (1,384 days), SPY returned +3.1% on average and its worst fall averaged -4.4%. A description of the past, not a forecast.
The market this week
The S&P 500 is down 2.0% this week, and most stocks fell: 1,857 up and 2,017 down. New 52-week lows outnumber new highs, 283 to 278. 51% of stocks are above their 200-day average (their average price over the past 200 trading days, a common sign of a rising trend), down from 53% last week.
| Measure | This week | Last week |
|---|---|---|
| S&P 500 (SPY) | -2.0% | +1.2% |
| SPY above (+) or below (−) its 200-day average | +5.7% | +8.2% |
| Stocks up / down | 1,857 / 2,017 | 1,920 / 2,035 |
| New 52-week highs / lows | 278 / 283 | 256 / 233 |
| Stocks above their 200-day average | 51% | 53% |
| Stocks above their 50-day average | 34% | 35% |
| Typical stock (median of the 500 most traded) | +0.4% | +1.6% |
| The 50 strongest trends (the strategies’ style) | -14.0% | -2.7% |
| SPY’s average daily move (past year: 0.6%) | 0.5% | 0.5% |
All US stocks and ADRs over $5 (4,069), to the close of Oct 16, 2026. Shown for context: the strategies do not use these measures.
Each indicator over time
The same layout for each: the blue line is the indicator, the green band its bullish zone, the red band its bearish zone (between them it counts as neutral), the grey line SPY, the dotted purple lines the Hindenburg Omen days.
Stocks above their 200-day average: 51% Neutral
The share of all US stocks over $5 closing above their 200-day average. Above 60%, most stocks are in a long-term rising trend; below 40%, most are not.
- The indicator (blue line)
- SPY, the S&P 500, on its own scale
- Bullish zone (at or above 60%)
- Bearish zone (at or below 40%)
- A Hindenburg Omen day
Show this chart’s numbers as a table
| Month end | Value |
|---|---|
| Oct 31, 2017 | 70% |
| Nov 30, 2017 | 73% |
| Dec 29, 2017 | 71% |
| Jan 31, 2018 | 72% |
| Feb 28, 2018 | 56% |
| Mar 29, 2018 | 56% |
| Apr 30, 2018 | 56% |
| May 31, 2018 | 63% |
| Jun 29, 2018 | 62% |
| Jul 31, 2018 | 65% |
| Aug 31, 2018 | 66% |
| Sep 28, 2018 | 59% |
| Oct 31, 2018 | 36% |
| Nov 30, 2018 | 38% |
| Dec 31, 2018 | 19% |
| Jan 31, 2019 | 39% |
| Feb 28, 2019 | 51% |
| Mar 29, 2019 | 48% |
| Apr 30, 2019 | 58% |
| May 31, 2019 | 41% |
| Jun 28, 2019 | 61% |
| Jul 31, 2019 | 64% |
| Aug 30, 2019 | 50% |
| Sep 30, 2019 | 58% |
| Oct 31, 2019 | 59% |
| Nov 29, 2019 | 66% |
| Dec 31, 2019 | 72% |
| Jan 31, 2020 | 60% |
| Feb 28, 2020 | 32% |
| Mar 31, 2020 | 12% |
| Apr 30, 2020 | 26% |
| May 29, 2020 | 36% |
| Jun 30, 2020 | 40% |
| Jul 31, 2020 | 46% |
| Aug 31, 2020 | 54% |
| Sep 30, 2020 | 51% |
| Oct 30, 2020 | 56% |
| Nov 30, 2020 | 87% |
| Dec 31, 2020 | 90% |
| Jan 29, 2021 | 88% |
| Feb 26, 2021 | 86% |
| Mar 31, 2021 | 86% |
| Apr 30, 2021 | 85% |
| May 28, 2021 | 81% |
| Jun 30, 2021 | 80% |
| Jul 30, 2021 | 69% |
| Aug 31, 2021 | 65% |
| Sep 30, 2021 | 52% |
| Oct 29, 2021 | 56% |
| Nov 30, 2021 | 45% |
| Dec 31, 2021 | 54% |
| Jan 31, 2022 | 40% |
| Feb 28, 2022 | 42% |
| Mar 31, 2022 | 46% |
| Apr 29, 2022 | 34% |
| May 31, 2022 | 33% |
| Jun 30, 2022 | 25% |
| Jul 29, 2022 | 38% |
| Aug 31, 2022 | 37% |
| Sep 30, 2022 | 29% |
| Oct 31, 2022 | 50% |
| Nov 30, 2022 | 62% |
| Dec 30, 2022 | 53% |
| Jan 31, 2023 | 72% |
| Feb 28, 2023 | 67% |
| Mar 31, 2023 | 59% |
| Apr 28, 2023 | 56% |
| May 31, 2023 | 52% |
| Jun 30, 2023 | 64% |
| Jul 31, 2023 | 72% |
| Aug 31, 2023 | 60% |
| Sep 29, 2023 | 49% |
| Oct 31, 2023 | 39% |
| Nov 30, 2023 | 58% |
| Dec 29, 2023 | 75% |
| Jan 31, 2024 | 69% |
| Feb 29, 2024 | 69% |
| Mar 28, 2024 | 74% |
| Apr 30, 2024 | 62% |
| May 31, 2024 | 67% |
| Jun 28, 2024 | 64% |
| Jul 31, 2024 | 75% |
| Aug 30, 2024 | 70% |
| Sep 30, 2024 | 70% |
| Oct 31, 2024 | 64% |
| Nov 29, 2024 | 72% |
| Dec 31, 2024 | 60% |
| Jan 31, 2025 | 62% |
| Feb 28, 2025 | 56% |
| Mar 31, 2025 | 42% |
| Apr 30, 2025 | 36% |
| May 30, 2025 | 47% |
| Jun 30, 2025 | 54% |
| Jul 31, 2025 | 54% |
| Aug 29, 2025 | 67% |
| Sep 30, 2025 | 66% |
| Oct 31, 2025 | 60% |
| Nov 28, 2025 | 64% |
| Dec 31, 2025 | 65% |
| Jan 30, 2026 | 68% |
| Feb 27, 2026 | 66% |
| Mar 31, 2026 | 54% |
| Apr 30, 2026 | 63% |
| May 29, 2026 | 63% |
| Jun 30, 2026 | 66% |
| Jul 31, 2026 | 65% |
| Aug 31, 2026 | 66% |
| Sep 30, 2026 | 51% |
| Oct 16, 2026 | 51% |
Stocks above their 50-day average: 33% Bearish
The share of all US stocks over $5 closing above their 50-day average. The shorter-term version: it turns first, in both directions.
- The indicator (blue line)
- SPY, the S&P 500, on its own scale
- Bullish zone (at or above 60%)
- Bearish zone (at or below 40%)
- A Hindenburg Omen day
Show this chart’s numbers as a table
| Month end | Value |
|---|---|
| Oct 31, 2017 | 67% |
| Nov 30, 2017 | 66% |
| Dec 29, 2017 | 61% |
| Jan 31, 2018 | 61% |
| Feb 28, 2018 | 34% |
| Mar 29, 2018 | 40% |
| Apr 30, 2018 | 51% |
| May 31, 2018 | 66% |
| Jun 29, 2018 | 56% |
| Jul 31, 2018 | 55% |
| Aug 31, 2018 | 61% |
| Sep 28, 2018 | 48% |
| Oct 31, 2018 | 18% |
| Nov 30, 2018 | 44% |
| Dec 31, 2018 | 17% |
| Jan 31, 2019 | 77% |
| Feb 28, 2019 | 84% |
| Mar 29, 2019 | 55% |
| Apr 30, 2019 | 63% |
| May 31, 2019 | 28% |
| Jun 28, 2019 | 62% |
| Jul 31, 2019 | 63% |
| Aug 30, 2019 | 40% |
| Sep 30, 2019 | 60% |
| Oct 31, 2019 | 65% |
| Nov 29, 2019 | 71% |
| Dec 31, 2019 | 75% |
| Jan 31, 2020 | 41% |
| Feb 28, 2020 | 12% |
| Mar 31, 2020 | 8% |
| Apr 30, 2020 | 63% |
| May 29, 2020 | 88% |
| Jun 30, 2020 | 72% |
| Jul 31, 2020 | 55% |
| Aug 31, 2020 | 66% |
| Sep 30, 2020 | 39% |
| Oct 30, 2020 | 38% |
| Nov 30, 2020 | 84% |
| Dec 31, 2020 | 84% |
| Jan 29, 2021 | 57% |
| Feb 26, 2021 | 64% |
| Mar 31, 2021 | 59% |
| Apr 30, 2021 | 61% |
| May 28, 2021 | 64% |
| Jun 30, 2021 | 51% |
| Jul 30, 2021 | 42% |
| Aug 31, 2021 | 58% |
| Sep 30, 2021 | 42% |
| Oct 29, 2021 | 58% |
| Nov 30, 2021 | 32% |
| Dec 31, 2021 | 48% |
| Jan 31, 2022 | 32% |
| Feb 28, 2022 | 41% |
| Mar 31, 2022 | 59% |
| Apr 29, 2022 | 32% |
| May 31, 2022 | 39% |
| Jun 30, 2022 | 28% |
| Jul 29, 2022 | 74% |
| Aug 31, 2022 | 52% |
| Sep 30, 2022 | 22% |
| Oct 31, 2022 | 66% |
| Nov 30, 2022 | 82% |
| Dec 30, 2022 | 51% |
| Jan 31, 2023 | 81% |
| Feb 28, 2023 | 61% |
| Mar 31, 2023 | 46% |
| Apr 28, 2023 | 49% |
| May 31, 2023 | 47% |
| Jun 30, 2023 | 72% |
| Jul 31, 2023 | 80% |
| Aug 31, 2023 | 50% |
| Sep 29, 2023 | 31% |
| Oct 31, 2023 | 28% |
| Nov 30, 2023 | 70% |
| Dec 29, 2023 | 86% |
| Jan 31, 2024 | 58% |
| Feb 29, 2024 | 58% |
| Mar 28, 2024 | 70% |
| Apr 30, 2024 | 39% |
| May 31, 2024 | 56% |
| Jun 28, 2024 | 51% |
| Jul 31, 2024 | 74% |
| Aug 30, 2024 | 71% |
| Sep 30, 2024 | 70% |
| Oct 31, 2024 | 51% |
| Nov 29, 2024 | 71% |
| Dec 31, 2024 | 35% |
| Jan 31, 2025 | 50% |
| Feb 28, 2025 | 45% |
| Mar 31, 2025 | 29% |
| Apr 30, 2025 | 41% |
| May 30, 2025 | 68% |
| Jun 30, 2025 | 73% |
| Jul 31, 2025 | 54% |
| Aug 29, 2025 | 68% |
| Sep 30, 2025 | 59% |
| Oct 31, 2025 | 44% |
| Nov 28, 2025 | 59% |
| Dec 31, 2025 | 58% |
| Jan 30, 2026 | 63% |
| Feb 27, 2026 | 55% |
| Mar 31, 2026 | 33% |
| Apr 30, 2026 | 66% |
| May 29, 2026 | 63% |
| Jun 30, 2026 | 64% |
| Jul 31, 2026 | 57% |
| Aug 31, 2026 | 52% |
| Sep 30, 2026 | 28% |
| Oct 16, 2026 | 33% |
Net new highs: -0.2% Neutral
Stocks closing at a 52-week high minus those at a 52-week low, as a share of all US stocks over $5. Positive: more stocks breaking out than breaking down.
- The indicator (blue line)
- SPY, the S&P 500, on its own scale
- Bullish zone (at or above +1.0%)
- Bearish zone (at or below -1.0%)
- A Hindenburg Omen day
Show this chart’s numbers as a table
| Month end | Value |
|---|---|
| Oct 31, 2017 | +7.6% |
| Nov 30, 2017 | +10.7% |
| Dec 29, 2017 | +3.2% |
| Jan 31, 2018 | +2.1% |
| Feb 28, 2018 | -2.5% |
| Mar 29, 2018 | +1.2% |
| Apr 30, 2018 | -0.1% |
| May 31, 2018 | +2.8% |
| Jun 29, 2018 | +1.2% |
| Jul 31, 2018 | +3.3% |
| Aug 31, 2018 | +6.9% |
| Sep 28, 2018 | +2.0% |
| Oct 31, 2018 | -2.0% |
| Nov 30, 2018 | +1.6% |
| Dec 31, 2018 | -0.8% |
| Jan 31, 2019 | +5.0% |
| Feb 28, 2019 | +3.3% |
| Mar 29, 2019 | +4.0% |
| Apr 30, 2019 | +5.4% |
| May 31, 2019 | -7.8% |
| Jun 28, 2019 | +6.0% |
| Jul 31, 2019 | +0.8% |
| Aug 30, 2019 | +2.4% |
| Sep 30, 2019 | +1.7% |
| Oct 31, 2019 | +3.8% |
| Nov 29, 2019 | +3.8% |
| Dec 31, 2019 | +4.9% |
| Jan 31, 2020 | -3.1% |
| Feb 28, 2020 | -15.1% |
| Mar 31, 2020 | -0.7% |
| Apr 30, 2020 | +1.1% |
| May 29, 2020 | +3.5% |
| Jun 30, 2020 | +3.5% |
| Jul 31, 2020 | +4.0% |
| Aug 31, 2020 | +2.9% |
| Sep 30, 2020 | +2.0% |
| Oct 30, 2020 | -0.6% |
| Nov 30, 2020 | +5.2% |
| Dec 31, 2020 | +6.1% |
| Jan 29, 2021 | +1.4% |
| Feb 26, 2021 | +2.8% |
| Mar 31, 2021 | +2.7% |
| Apr 30, 2021 | +4.4% |
| May 28, 2021 | +6.9% |
| Jun 30, 2021 | +2.6% |
| Jul 30, 2021 | +3.7% |
| Aug 31, 2021 | +5.3% |
| Sep 30, 2021 | -0.0% |
| Oct 29, 2021 | +4.7% |
| Nov 30, 2021 | -7.9% |
| Dec 31, 2021 | +3.8% |
| Jan 31, 2022 | +1.0% |
| Feb 28, 2022 | +0.5% |
| Mar 31, 2022 | -0.3% |
| Apr 29, 2022 | -10.6% |
| May 31, 2022 | +0.5% |
| Jun 30, 2022 | -5.5% |
| Jul 29, 2022 | +2.8% |
| Aug 31, 2022 | -3.3% |
| Sep 30, 2022 | -11.0% |
| Oct 31, 2022 | +6.6% |
| Nov 30, 2022 | +8.8% |
| Dec 30, 2022 | +7.1% |
| Jan 31, 2023 | +11.2% |
| Feb 28, 2023 | +7.2% |
| Mar 31, 2023 | +7.4% |
| Apr 28, 2023 | +5.5% |
| May 31, 2023 | +2.0% |
| Jun 30, 2023 | +10.6% |
| Jul 31, 2023 | +8.9% |
| Aug 31, 2023 | +5.3% |
| Sep 29, 2023 | +1.4% |
| Oct 31, 2023 | -0.1% |
| Nov 30, 2023 | +6.0% |
| Dec 29, 2023 | +3.8% |
| Jan 31, 2024 | +2.2% |
| Feb 29, 2024 | +8.8% |
| Mar 28, 2024 | +11.4% |
| Apr 30, 2024 | +1.2% |
| May 31, 2024 | +5.5% |
| Jun 28, 2024 | +3.8% |
| Jul 31, 2024 | +8.8% |
| Aug 30, 2024 | +11.3% |
| Sep 30, 2024 | +6.9% |
| Oct 31, 2024 | +0.2% |
| Nov 29, 2024 | +7.9% |
| Dec 31, 2024 | +1.3% |
| Jan 31, 2025 | +1.5% |
| Feb 28, 2025 | +1.0% |
| Mar 31, 2025 | -4.6% |
| Apr 30, 2025 | +1.1% |
| May 30, 2025 | +2.2% |
| Jun 30, 2025 | +5.2% |
| Jul 31, 2025 | +0.0% |
| Aug 29, 2025 | +4.5% |
| Sep 30, 2025 | +5.8% |
| Oct 31, 2025 | +1.7% |
| Nov 28, 2025 | +6.4% |
| Dec 31, 2025 | +0.4% |
| Jan 30, 2026 | +1.6% |
| Feb 27, 2026 | +6.0% |
| Mar 31, 2026 | +2.3% |
| Apr 30, 2026 | +7.1% |
| May 29, 2026 | +4.2% |
| Jun 30, 2026 | +6.8% |
| Jul 31, 2026 | +1.7% |
| Aug 31, 2026 | +1.1% |
| Sep 30, 2026 | -2.6% |
| Oct 16, 2026 | -0.2% |
Advancing stocks: 45% Neutral
The share of all US stocks over $5 that are higher than two weeks (10 sessions) ago. Whether the typical stock has been rising lately, whatever the index did.
- The indicator (blue line)
- SPY, the S&P 500, on its own scale
- Bullish zone (at or above 55%)
- Bearish zone (at or below 45%)
- A Hindenburg Omen day
Show this chart’s numbers as a table
| Month end | Value |
|---|---|
| Oct 31, 2017 | 50% |
| Nov 30, 2017 | 80% |
| Dec 29, 2017 | 66% |
| Jan 31, 2018 | 43% |
| Feb 28, 2018 | 54% |
| Mar 29, 2018 | 31% |
| Apr 30, 2018 | 44% |
| May 31, 2018 | 55% |
| Jun 29, 2018 | 35% |
| Jul 31, 2018 | 48% |
| Aug 31, 2018 | 65% |
| Sep 28, 2018 | 44% |
| Oct 31, 2018 | 25% |
| Nov 30, 2018 | 56% |
| Dec 31, 2018 | 24% |
| Jan 31, 2019 | 74% |
| Feb 28, 2019 | 64% |
| Mar 29, 2019 | 46% |
| Apr 30, 2019 | 56% |
| May 31, 2019 | 17% |
| Jun 28, 2019 | 71% |
| Jul 31, 2019 | 55% |
| Aug 30, 2019 | 54% |
| Sep 30, 2019 | 33% |
| Oct 31, 2019 | 62% |
| Nov 29, 2019 | 65% |
| Dec 31, 2019 | 64% |
| Jan 31, 2020 | 22% |
| Feb 28, 2020 | 7% |
| Mar 31, 2020 | 61% |
| Apr 30, 2020 | 85% |
| May 29, 2020 | 90% |
| Jun 30, 2020 | 37% |
| Jul 31, 2020 | 50% |
| Aug 31, 2020 | 39% |
| Sep 30, 2020 | 30% |
| Oct 30, 2020 | 23% |
| Nov 30, 2020 | 70% |
| Dec 31, 2020 | 56% |
| Jan 29, 2021 | 28% |
| Feb 26, 2021 | 41% |
| Mar 31, 2021 | 26% |
| Apr 30, 2021 | 53% |
| May 28, 2021 | 60% |
| Jun 30, 2021 | 41% |
| Jul 30, 2021 | 64% |
| Aug 31, 2021 | 72% |
| Sep 30, 2021 | 41% |
| Oct 29, 2021 | 55% |
| Nov 30, 2021 | 11% |
| Dec 31, 2021 | 78% |
| Jan 31, 2022 | 19% |
| Feb 28, 2022 | 48% |
| Mar 31, 2022 | 59% |
| Apr 29, 2022 | 21% |
| May 31, 2022 | 74% |
| Jun 30, 2022 | 47% |
| Jul 29, 2022 | 82% |
| Aug 31, 2022 | 19% |
| Sep 30, 2022 | 20% |
| Oct 31, 2022 | 80% |
| Nov 30, 2022 | 61% |
| Dec 30, 2022 | 52% |
| Jan 31, 2023 | 69% |
| Feb 28, 2023 | 36% |
| Mar 31, 2023 | 78% |
| Apr 28, 2023 | 46% |
| May 31, 2023 | 52% |
| Jun 30, 2023 | 51% |
| Jul 31, 2023 | 64% |
| Aug 31, 2023 | 63% |
| Sep 29, 2023 | 29% |
| Oct 31, 2023 | 23% |
| Nov 30, 2023 | 56% |
| Dec 29, 2023 | 62% |
| Jan 31, 2024 | 60% |
| Feb 29, 2024 | 59% |
| Mar 28, 2024 | 75% |
| Apr 30, 2024 | 55% |
| May 31, 2024 | 38% |
| Jun 28, 2024 | 54% |
| Jul 31, 2024 | 54% |
| Aug 30, 2024 | 75% |
| Sep 30, 2024 | 61% |
| Oct 31, 2024 | 30% |
| Nov 29, 2024 | 76% |
| Dec 31, 2024 | 22% |
| Jan 31, 2025 | 61% |
| Feb 28, 2025 | 33% |
| Mar 31, 2025 | 37% |
| Apr 30, 2025 | 79% |
| May 30, 2025 | 40% |
| Jun 30, 2025 | 70% |
| Jul 31, 2025 | 37% |
| Aug 29, 2025 | 72% |
| Sep 30, 2025 | 48% |
| Oct 31, 2025 | 53% |
| Nov 28, 2025 | 68% |
| Dec 31, 2025 | 42% |
| Jan 30, 2026 | 42% |
| Feb 27, 2026 | 55% |
| Mar 31, 2026 | 46% |
| Apr 30, 2026 | 56% |
| May 29, 2026 | 60% |
| Jun 30, 2026 | 61% |
| Jul 31, 2026 | 48% |
| Aug 31, 2026 | 41% |
| Sep 30, 2026 | 32% |
| Oct 16, 2026 | 45% |
Typical stock: -2.0% Neutral
The median return of all US stocks over $5 over the past month. How an ordinary stock has done, rather than the largest companies that drive the index.
- The indicator (blue line)
- SPY, the S&P 500, on its own scale
- Bullish zone (at or above +2.0%)
- Bearish zone (at or below -2.0%)
- A Hindenburg Omen day
Show this chart’s numbers as a table
| Month end | Value |
|---|---|
| Oct 31, 2017 | +0.1% |
| Nov 30, 2017 | +2.3% |
| Dec 29, 2017 | +0.4% |
| Jan 31, 2018 | +2.3% |
| Feb 28, 2018 | -5.2% |
| Mar 29, 2018 | +0.7% |
| Apr 30, 2018 | +0.8% |
| May 31, 2018 | +3.1% |
| Jun 29, 2018 | +0.6% |
| Jul 31, 2018 | +1.5% |
| Aug 31, 2018 | +1.7% |
| Sep 28, 2018 | -1.5% |
| Oct 31, 2018 | -7.0% |
| Nov 30, 2018 | +1.8% |
| Dec 31, 2018 | -9.5% |
| Jan 31, 2019 | +10.5% |
| Feb 28, 2019 | +5.5% |
| Mar 29, 2019 | -0.9% |
| Apr 30, 2019 | +2.9% |
| May 31, 2019 | -5.1% |
| Jun 28, 2019 | +4.7% |
| Jul 31, 2019 | +0.4% |
| Aug 30, 2019 | -2.6% |
| Sep 30, 2019 | +3.2% |
| Oct 31, 2019 | +4.2% |
| Nov 29, 2019 | +2.4% |
| Dec 31, 2019 | +2.6% |
| Jan 31, 2020 | -2.8% |
| Feb 28, 2020 | -10.2% |
| Mar 31, 2020 | -22.3% |
| Apr 30, 2020 | +13.2% |
| May 29, 2020 | +1.3% |
| Jun 30, 2020 | +1.4% |
| Jul 31, 2020 | +2.3% |
| Aug 31, 2020 | +3.9% |
| Sep 30, 2020 | -3.4% |
| Oct 30, 2020 | -0.7% |
| Nov 30, 2020 | +14.2% |
| Dec 31, 2020 | +4.5% |
| Jan 29, 2021 | +2.0% |
| Feb 26, 2021 | +5.9% |
| Mar 31, 2021 | +1.3% |
| Apr 30, 2021 | +2.8% |
| May 28, 2021 | +0.5% |
| Jun 30, 2021 | -0.9% |
| Jul 30, 2021 | -1.8% |
| Aug 31, 2021 | +1.8% |
| Sep 30, 2021 | -3.1% |
| Oct 29, 2021 | +2.8% |
| Nov 30, 2021 | -3.4% |
| Dec 31, 2021 | +4.6% |
| Jan 31, 2022 | -4.6% |
| Feb 28, 2022 | +2.3% |
| Mar 31, 2022 | +0.4% |
| Apr 29, 2022 | -6.4% |
| May 31, 2022 | -0.1% |
| Jun 30, 2022 | -5.5% |
| Jul 29, 2022 | +5.3% |
| Aug 31, 2022 | -0.3% |
| Sep 30, 2022 | -7.1% |
| Oct 31, 2022 | +6.3% |
| Nov 30, 2022 | +1.8% |
| Dec 30, 2022 | -2.9% |
| Jan 31, 2023 | +6.3% |
| Feb 28, 2023 | 0.0% |
| Mar 31, 2023 | -1.5% |
| Apr 28, 2023 | +0.4% |
| May 31, 2023 | -0.7% |
| Jun 30, 2023 | +5.2% |
| Jul 31, 2023 | +3.7% |
| Aug 31, 2023 | -1.1% |
| Sep 29, 2023 | -4.0% |
| Oct 31, 2023 | -2.6% |
| Nov 30, 2023 | +7.4% |
| Dec 29, 2023 | +8.2% |
| Jan 31, 2024 | -1.6% |
| Feb 29, 2024 | +0.3% |
| Mar 28, 2024 | +3.3% |
| Apr 30, 2024 | -3.7% |
| May 31, 2024 | +2.4% |
| Jun 28, 2024 | +0.4% |
| Jul 31, 2024 | +7.4% |
| Aug 30, 2024 | +2.1% |
| Sep 30, 2024 | +1.2% |
| Oct 31, 2024 | 0.0% |
| Nov 29, 2024 | +5.9% |
| Dec 31, 2024 | -6.0% |
| Jan 31, 2025 | +2.7% |
| Feb 28, 2025 | -2.0% |
| Mar 31, 2025 | -5.0% |
| Apr 30, 2025 | -1.8% |
| May 30, 2025 | +4.3% |
| Jun 30, 2025 | +2.9% |
| Jul 31, 2025 | -0.5% |
| Aug 29, 2025 | +5.2% |
| Sep 30, 2025 | -0.1% |
| Oct 31, 2025 | -1.3% |
| Nov 28, 2025 | +2.0% |
| Dec 31, 2025 | +1.0% |
| Jan 30, 2026 | +2.9% |
| Feb 27, 2026 | +1.0% |
| Mar 31, 2026 | -4.9% |
| Apr 30, 2026 | +5.8% |
| May 29, 2026 | +1.6% |
| Jun 30, 2026 | +3.1% |
| Jul 31, 2026 | -0.0% |
| Aug 31, 2026 | +0.7% |
| Sep 30, 2026 | -4.6% |
| Oct 16, 2026 | -2.0% |
S&P 500 trend: +5.7% Bullish
How far SPY closed above (or below) its 200-day average. The index's own long-term trend.
- The indicator (blue line)
- SPY, the S&P 500, on its own scale
- Bullish zone (at or above +2.0%)
- Bearish zone (at or below -2.0%)
- A Hindenburg Omen day
Show this chart’s numbers as a table
| Month end | Value |
|---|---|
| Oct 31, 2017 | +7.1% |
| Nov 30, 2017 | +8.8% |
| Dec 29, 2017 | +8.6% |
| Jan 31, 2018 | +12.5% |
| Feb 28, 2018 | +6.9% |
| Mar 29, 2018 | +2.6% |
| Apr 30, 2018 | +2.1% |
| May 31, 2018 | +3.4% |
| Jun 29, 2018 | +2.6% |
| Jul 31, 2018 | +5.1% |
| Aug 31, 2018 | +7.0% |
| Sep 28, 2018 | +6.5% |
| Oct 31, 2018 | -1.4% |
| Nov 30, 2018 | +0.5% |
| Dec 31, 2018 | -8.0% |
| Jan 31, 2019 | -0.6% |
| Feb 28, 2019 | +2.2% |
| Mar 29, 2019 | +3.6% |
| Apr 30, 2019 | +7.0% |
| May 31, 2019 | -0.1% |
| Jun 28, 2019 | +6.6% |
| Jul 31, 2019 | +7.6% |
| Aug 30, 2019 | +5.0% |
| Sep 30, 2019 | +5.8% |
| Oct 31, 2019 | +6.0% |
| Nov 29, 2019 | +8.1% |
| Dec 31, 2019 | +9.6% |
| Jan 31, 2020 | +7.8% |
| Feb 28, 2020 | -2.1% |
| Mar 31, 2020 | -13.8% |
| Apr 30, 2020 | -2.3% |
| May 29, 2020 | +2.3% |
| Jun 30, 2020 | +3.2% |
| Jul 31, 2020 | +8.2% |
| Aug 31, 2020 | +14.1% |
| Sep 30, 2020 | +8.8% |
| Oct 30, 2020 | +5.2% |
| Nov 30, 2020 | +15.6% |
| Dec 31, 2020 | +16.7% |
| Jan 29, 2021 | +11.4% |
| Feb 26, 2021 | +11.1% |
| Mar 31, 2021 | +12.7% |
| Apr 30, 2021 | +15.1% |
| May 28, 2021 | +12.9% |
| Jun 30, 2021 | +12.6% |
| Jul 30, 2021 | +12.2% |
| Aug 31, 2021 | +12.2% |
| Sep 30, 2021 | +4.7% |
| Oct 29, 2021 | +9.9% |
| Nov 30, 2021 | +6.7% |
| Dec 31, 2021 | +9.3% |
| Jan 31, 2022 | +2.2% |
| Feb 28, 2022 | -1.5% |
| Mar 31, 2022 | +1.6% |
| Apr 29, 2022 | -7.6% |
| May 31, 2022 | -6.7% |
| Jun 30, 2022 | -13.3% |
| Jul 29, 2022 | -4.4% |
| Aug 31, 2022 | -7.3% |
| Sep 30, 2022 | -14.3% |
| Oct 31, 2022 | -5.2% |
| Nov 30, 2022 | +1.4% |
| Dec 30, 2022 | -3.6% |
| Jan 31, 2023 | +3.8% |
| Feb 28, 2023 | +1.4% |
| Mar 31, 2023 | +5.1% |
| Apr 28, 2023 | +5.9% |
| May 31, 2023 | +5.9% |
| Jun 30, 2023 | +11.9% |
| Jul 31, 2023 | +13.2% |
| Aug 31, 2023 | +9.1% |
| Sep 29, 2023 | +2.7% |
| Oct 31, 2023 | -0.6% |
| Nov 30, 2023 | +7.3% |
| Dec 29, 2023 | +10.2% |
| Jan 31, 2024 | +9.8% |
| Feb 29, 2024 | +13.1% |
| Mar 28, 2024 | +14.3% |
| Apr 30, 2024 | +7.8% |
| May 31, 2024 | +11.2% |
| Jun 28, 2024 | +12.8% |
| Jul 31, 2024 | +11.1% |
| Aug 30, 2024 | +10.6% |
| Sep 30, 2024 | +10.6% |
| Oct 31, 2024 | +7.0% |
| Nov 29, 2024 | +11.2% |
| Dec 31, 2024 | +6.5% |
| Jan 31, 2025 | +7.7% |
| Feb 28, 2025 | +4.6% |
| Mar 31, 2025 | -2.0% |
| Apr 30, 2025 | -2.7% |
| May 30, 2025 | +2.6% |
| Jun 30, 2025 | +6.9% |
| Jul 31, 2025 | +8.0% |
| Aug 29, 2025 | +9.0% |
| Sep 30, 2025 | +11.6% |
| Oct 31, 2025 | +12.4% |
| Nov 28, 2025 | +11.3% |
| Dec 31, 2025 | +9.4% |
| Jan 30, 2026 | +8.4% |
| Feb 27, 2026 | +5.3% |
| Mar 31, 2026 | -1.2% |
| Apr 30, 2026 | +7.7% |
| May 29, 2026 | +11.5% |
| Jun 30, 2026 | +8.6% |
| Jul 31, 2026 | +7.1% |
| Aug 31, 2026 | +8.4% |
| Sep 30, 2026 | +6.5% |
| Oct 16, 2026 | +5.7% |
Volatility: 10% Bullish
SPY's daily moves over the past month, as a yearly figure (annualised standard deviation). Calm markets (under 15%) tend to be rising ones; above 25% is a stressed market.
- The indicator (blue line)
- SPY, the S&P 500, on its own scale
- Bullish zone (at or below 15%)
- Bearish zone (at or above 25%)
- A Hindenburg Omen day
Show this chart’s numbers as a table
| Month end | Value |
|---|---|
| Oct 31, 2017 | 5% |
| Nov 30, 2017 | 7% |
| Dec 29, 2017 | 6% |
| Jan 31, 2018 | 9% |
| Feb 28, 2018 | 27% |
| Mar 29, 2018 | 20% |
| Apr 30, 2018 | 16% |
| May 31, 2018 | 11% |
| Jun 29, 2018 | 8% |
| Jul 31, 2018 | 9% |
| Aug 31, 2018 | 7% |
| Sep 28, 2018 | 5% |
| Oct 31, 2018 | 24% |
| Nov 30, 2018 | 19% |
| Dec 31, 2018 | 29% |
| Jan 31, 2019 | 19% |
| Feb 28, 2019 | 8% |
| Mar 29, 2019 | 12% |
| Apr 30, 2019 | 5% |
| May 31, 2019 | 15% |
| Jun 28, 2019 | 11% |
| Jul 31, 2019 | 8% |
| Aug 30, 2019 | 24% |
| Sep 30, 2019 | 9% |
| Oct 31, 2019 | 11% |
| Nov 29, 2019 | 6% |
| Dec 31, 2019 | 7% |
| Jan 31, 2020 | 12% |
| Feb 28, 2020 | 25% |
| Mar 31, 2020 | 92% |
| Apr 30, 2020 | 37% |
| May 29, 2020 | 22% |
| Jun 30, 2020 | 30% |
| Jul 31, 2020 | 14% |
| Aug 31, 2020 | 8% |
| Sep 30, 2020 | 25% |
| Oct 30, 2020 | 21% |
| Nov 30, 2020 | 16% |
| Dec 31, 2020 | 8% |
| Jan 29, 2021 | 16% |
| Feb 26, 2021 | 16% |
| Mar 31, 2021 | 14% |
| Apr 30, 2021 | 10% |
| May 28, 2021 | 14% |
| Jun 30, 2021 | 9% |
| Jul 30, 2021 | 12% |
| Aug 31, 2021 | 8% |
| Sep 30, 2021 | 13% |
| Oct 29, 2021 | 11% |
| Nov 30, 2021 | 13% |
| Dec 31, 2021 | 16% |
| Jan 31, 2022 | 19% |
| Feb 28, 2022 | 23% |
| Mar 31, 2022 | 23% |
| Apr 29, 2022 | 25% |
| May 31, 2022 | 32% |
| Jun 30, 2022 | 30% |
| Jul 29, 2022 | 19% |
| Aug 31, 2022 | 20% |
| Sep 30, 2022 | 24% |
| Oct 31, 2022 | 27% |
| Nov 30, 2022 | 29% |
| Dec 30, 2022 | 18% |
| Jan 31, 2023 | 17% |
| Feb 28, 2023 | 16% |
| Mar 31, 2023 | 19% |
| Apr 28, 2023 | 13% |
| May 31, 2023 | 13% |
| Jun 30, 2023 | 11% |
| Jul 31, 2023 | 8% |
| Aug 31, 2023 | 12% |
| Sep 29, 2023 | 11% |
| Oct 31, 2023 | 14% |
| Nov 30, 2023 | 11% |
| Dec 29, 2023 | 9% |
| Jan 31, 2024 | 11% |
| Feb 29, 2024 | 12% |
| Mar 28, 2024 | 10% |
| Apr 30, 2024 | 14% |
| May 31, 2024 | 9% |
| Jun 28, 2024 | 7% |
| Jul 31, 2024 | 15% |
| Aug 30, 2024 | 18% |
| Sep 30, 2024 | 14% |
| Oct 31, 2024 | 12% |
| Nov 29, 2024 | 12% |
| Dec 31, 2024 | 15% |
| Jan 31, 2025 | 14% |
| Feb 28, 2025 | 13% |
| Mar 31, 2025 | 21% |
| Apr 30, 2025 | 54% |
| May 30, 2025 | 17% |
| Jun 30, 2025 | 10% |
| Jul 31, 2025 | 7% |
| Aug 29, 2025 | 10% |
| Sep 30, 2025 | 7% |
| Oct 31, 2025 | 15% |
| Nov 28, 2025 | 15% |
| Dec 31, 2025 | 9% |
| Jan 30, 2026 | 10% |
| Feb 27, 2026 | 13% |
| Mar 31, 2026 | 19% |
| Apr 30, 2026 | 12% |
| May 29, 2026 | 10% |
| Jun 30, 2026 | 18% |
| Jul 31, 2026 | 13% |
| Aug 31, 2026 | 9% |
| Sep 30, 2026 | 11% |
| Oct 16, 2026 | 10% |
How it is measured
Momentum stocks. The pool every strategy ranks and picks from, rebuilt every trading day: US common stocks and ADRs, not traded over the counter, closing at $5 or more, whose average daily dollar volume over 20 sessions cleared $10 million at the close and 21 and 42 sessions before, then the 500 with the highest. The leaders are the 50 of them with the strongest 12-1 momentum, the signal the strategies rank by.
- Momentum participation: The share of the pool whose 12-1 momentum is positive: up over the past year, leaving out the latest month. Bullish at or above 60%, bearish at or below 40%, neutral between.
- Momentum payoff: Over the past month, the strongest tenth of the pool (by 12-1 momentum a month ago) against the weakest tenth: the difference in their average returns. Bullish at or above +2%, bearish at or below -2%, neutral between.
- Leaders in trend: The share of the 50 strongest stocks in the pool closing above their 50-day average. Bullish at or above 70%, bearish at or below 40%, neutral between.
- Leaders' pullback: The median fall of the 50 strongest stocks from their 52-week closing high. Bullish at or above -10%, bearish at or below -20%, neutral between.
- Pool trend: The share of the pool closing above its 200-day average (the 50-day share is shown alongside). Bullish at or above 60%, bearish at or below 40%, neutral between.
- Net new highs: Stocks in the pool closing at a 52-week high minus those at a 52-week low, as a share of the pool. Bullish at or above +3%, bearish at or below -3%, neutral between.
- Leadership: The leaders' median return over the past month minus the median return of the whole pool. Bullish at or above +2%, bearish at or below -2%, neutral between.
- Rotation: The share of today's 50 strongest stocks that were not among the 50 strongest a month ago. Bullish at or below 20%, bearish at or above 40%, neutral between.
- Crowding: The largest single sector's share of the 50 strongest stocks. Bullish at or below 30%, bearish at or above 50%, neutral between.
Whole market. Every US common stock and ADR closing at $5 or more, not traded over the counter, with a year of prices.
- Stocks above their 200-day average: The share of all US stocks over $5 closing above their 200-day average. Bullish at or above 60%, bearish at or below 40%, neutral between.
- Stocks above their 50-day average: The share of all US stocks over $5 closing above their 50-day average. Bullish at or above 60%, bearish at or below 40%, neutral between.
- Net new highs: Stocks closing at a 52-week high minus those at a 52-week low, as a share of all US stocks over $5. Bullish at or above +1%, bearish at or below -1%, neutral between.
- Advancing stocks: The share of all US stocks over $5 that are higher than two weeks (10 sessions) ago. Bullish at or above 55%, bearish at or below 45%, neutral between.
- Typical stock: The median return of all US stocks over $5 over the past month. Bullish at or above +2%, bearish at or below -2%, neutral between.
- S&P 500 trend: How far SPY closed above (or below) its 200-day average. Bullish at or above +2%, bearish at or below -2%, neutral between.
- Volatility: SPY's daily moves over the past month, as a yearly figure (annualised standard deviation). Bullish at or below 15%, bearish at or above 25%, neutral between.
The scores. Each indicator counts the same: bullish +1, neutral 0, bearish −1. Score = 50 + 50 × the average (momentum stocks: on days with at least 7 of the nine readings; whole market: at least 5 of the seven). Weak is 35 or less, Soft under 45, Mixed 45 to 55, Firm over 55, Strong 65 or more. The levels are round numbers set once, not fitted to the record. Prices are adjusted for splits and dividends. Hindenburg Omen days are the days this site’s version of the signal fired (how it was tested). For more on the whole market’s breadth, from the Hindenburg Omen to the McClellan Oscillator, see Bear Rhythm.
The Bull Rhythm Weekly · every Friday after the close
Follow the strategies as they run live
Eight strategies with fixed rules, every decision made at the day’s close. Each Friday, see where the record stands: what each one made, what it bought and sold, and why.
- This week’s result and the running total since going live, next to the S&P 500
- Every buy and every sale, with the reason in plain words
- What each one holds now, with charts
- The good weeks and the bad ones, reported the same way
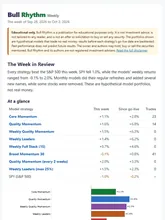 See a sample
issue →